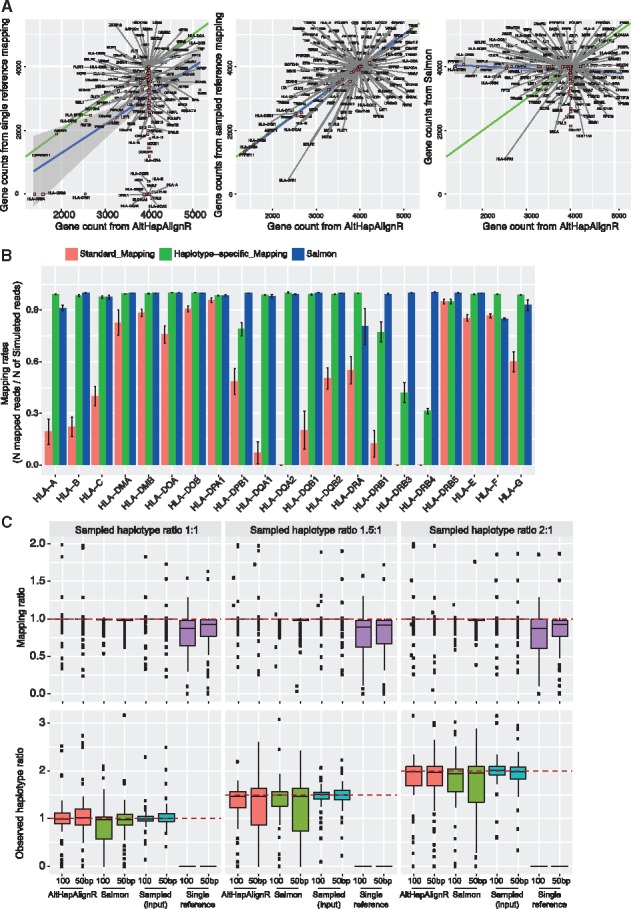
Fig. 2.

Accuracy of estimated gene and haplotype level expression using simulated data for MHC genes. (A) Gene counts for input simulated reads (100 bp) comparing mapped read counts using single reference, AltHapAlignR or Salmon. (B) Mapping rates between single reference-based mapping, AltHapAlignR or Salmon for HLA genes (error bars SEM). (C) Estimated mapping ratios relative to true actual sample ratios. Expected mapping ratio is indicated by a dashed line. At haplotype level, boxplots show estimated haplotype ratios with actual ratios indicated by dashed lines
