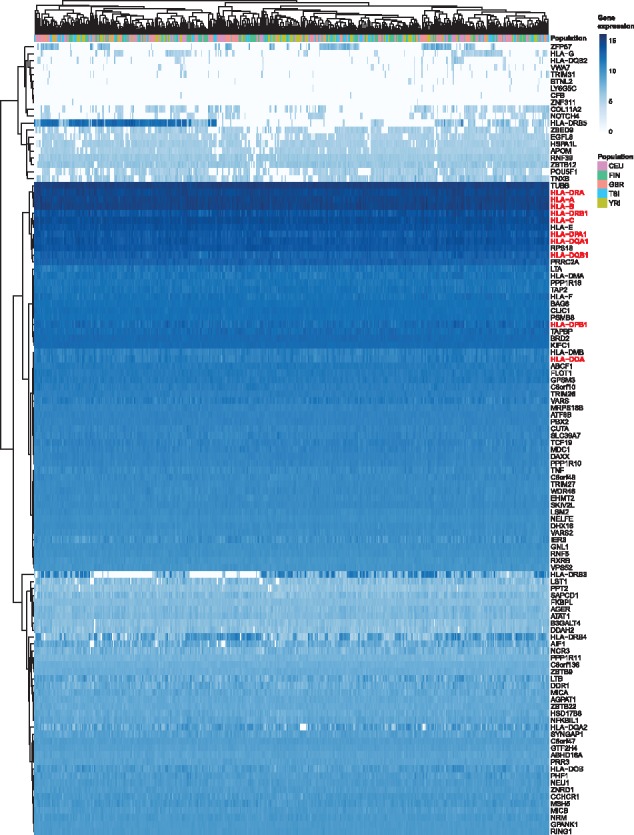
Fig. 4.

Heat map diagram of MHC gene expression analysed by AltHapAlignR for GEUVADIS cohort. Gene level expression for 114 genes in the MHC from 462 individuals in five populations shown. Each column represents an individual, each row a single gene (classical HLA genes highlighted). Normalized log2 expression levels shown (white, low intensities; dark shading, high intensities)
