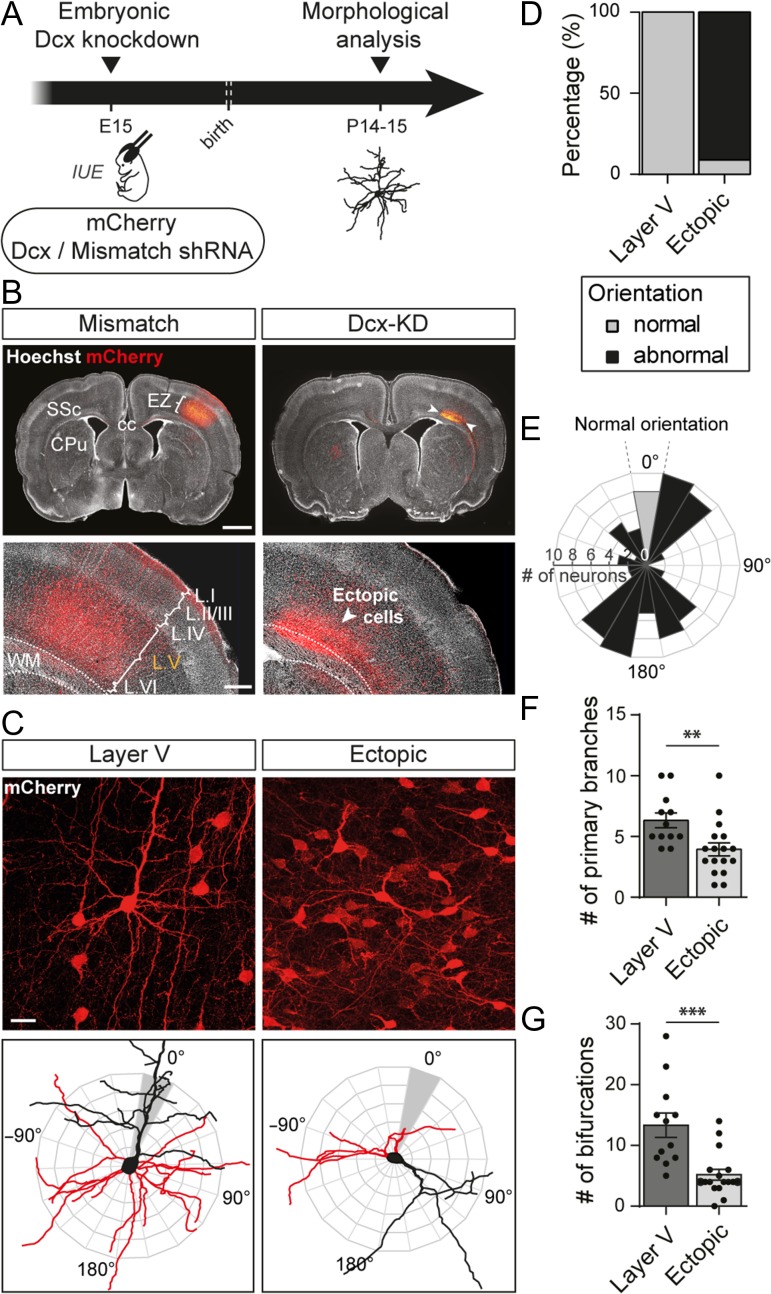
Figure 1.
Altered neuronal positioning impairs neuronal polarity and morphology. (A) Schematic of the experimental timeline. Embryos were electroporated in utero at E15 with a plasmid encoding a short hairpin RNA (shRNA) targeting Dcx 3′UTR to create an embryonic Dcx knockdown or with a mismatch shRNA for control. A second plasmid encoding a red fluorescent protein, mCherry, was co-electroporated to spot the electroporated neurons. IUE: in utero electroporation (B) Representative neocortical sections showing that mismatch neurons are properly placed in layer (L) V of the somatosensory cortex (SSc) while Dcx-KD neurons are located ectopically between the corpus callosum (cc) and layer VI of the cortex at P14. Dotted lines delineate the white matter (WM). EZ = electroporation zone; CPu = caudate putamen. Top panels, scale bar = 2 mm. Bottom panels, scale bar = 500 μm. (C) High magnification confocal images of layer V and ectopic neurons used to reconstruct their dendritic arbors (top panels). The 3D reconstructions are superimposed on orientation diagrams used to score apical dendrite orientation in (E) (bottom panels). Red: basal arbor; black: apical arbor and soma. Scale bar = 100 μm. (D) Stacked bar graph showing the percentage of normally or abnormally oriented neurons in each set of data analyzed in (F) and (G). (E) Polar histogram of apical dendrite orientation (in degrees) in ectopic neurons. Bars represent the number of neurons with a similar apical dendrite orientation in 20° bins. Properly oriented neurons are plotted in grey. Neuronal somata are located at the center as depicted in (C). (F,G) Quantification of the mean number of primary branches (F) and bifurcations (G) in 3D reconstructions from layer V and ectopic neurons. Values are given as mean ± SEM. Each dot represents a neuron. (F) t-test, P-value < 0.0074; (G) Mann–Whitney test, P-value < 0.0001.

