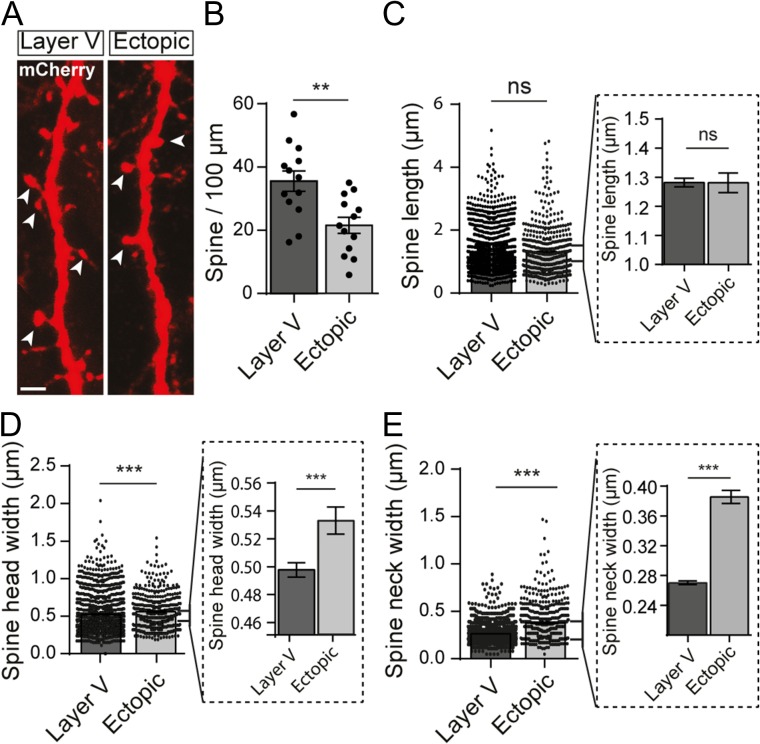
Figure 2.
Ectopic neurons display a reduced spine density and altered spine morphology. (A) High magnification confocal images of dendrites from layer V and ectopic neurons electroporated with mCherry. Representative dendritic spines are indicated by arrow heads. Scale bar = 2 μm. (B) Bar graph illustrating the mean number of spines per 100 μm of dendrite. Values are given as mean ± SEM. Each dot represents a neuron. t-test, P-value = 0.0024. (C–E) Quantification of the mean dendritic spine length (C), head width (D), and neck width (E) in layer V and ectopic neurons. Values are given as mean ± SEM. Each dot represents a spine. Bar graphs in dotted line frames are higher magnifications of the initial bar graphs. (D,E) Mann–Whitney test, P-value < 0.0001.

