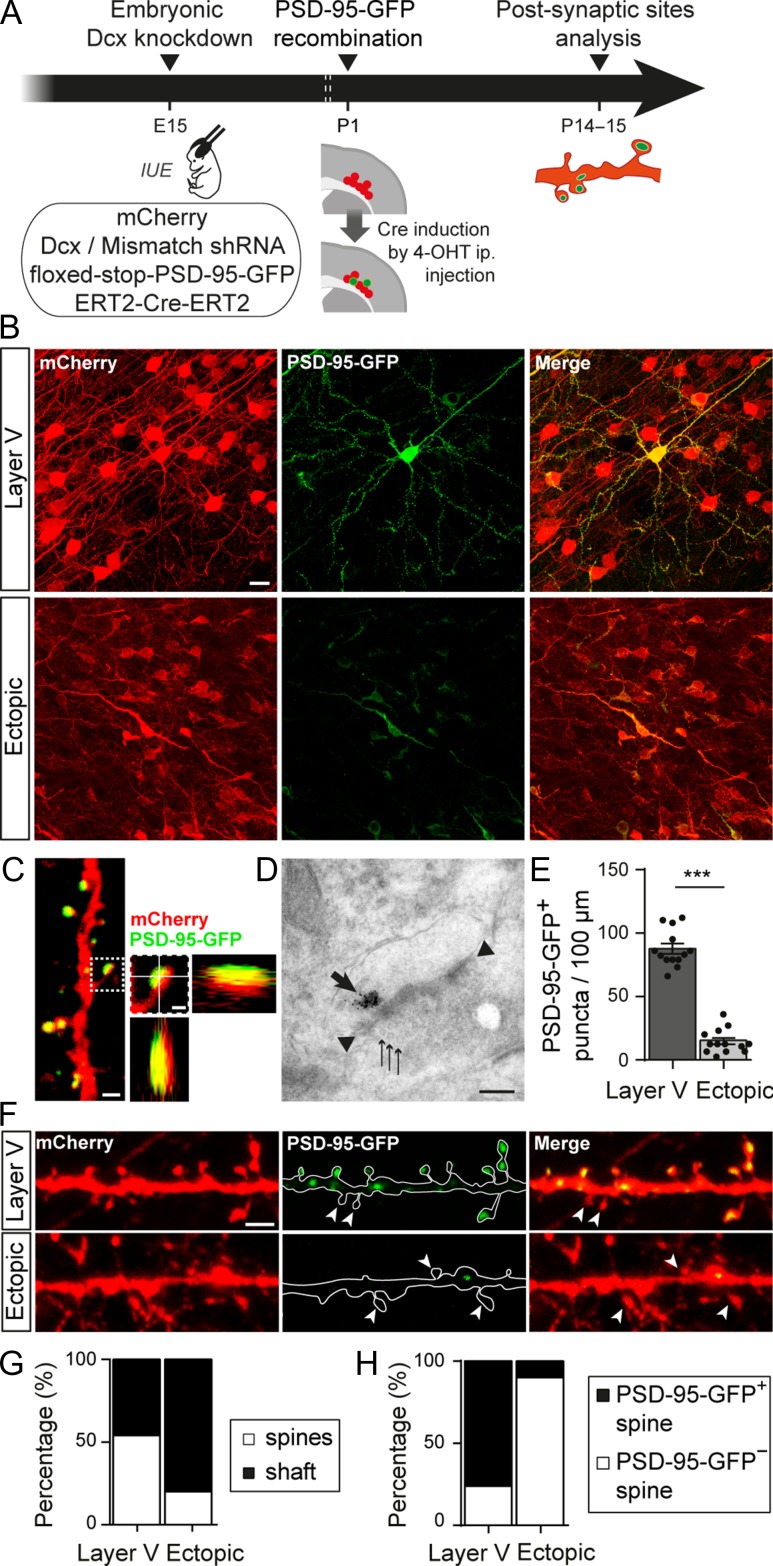
Figure 3.
Altered neuronal positioning decreases the density of glutamatergic synapses. (A) Animals were electroporated at E15 with 3 plasmids encoding for the fluorescent marker mCherry, a Dcx or mismatch shRNA and a tamoxifen activable Cre-recombinase (ERT2-Cre-ERT2). A fourth conditional plasmid was co-electroporated to express the postsynaptic glutamatergic protein PSD-95-GFP (floxed-stop-PSD-95-GFP). Sparse recombination of the floxed-stop-PSD-95-GFP plasmid was induced in a subset of electroporated neurons through a single intraperitoneal (i.p.) injection of 4-hydroxytamoxifen (4-OHT) at P1. Glutamatergic postsynaptic sites were analyzed at P14–15. IUE: in utero electroporation. (B) Confocal images of the electroporated zone (red) showing sparse recombination of the floxed-stop-PSD-95-GFP plasmid (green) following 4-OHT injection. Scale bar = 20 μm. (C) High magnification confocal image of a dendrite with PSD-95-GFP+ spines. On the right, higher magnification of one dendritic spine and its orthogonal views show that the PSD-95-GFP+ punctum colocalizes with the mCherry filled spine. Left image scale bar = 1 μm; right image scale bar = 0.5 μm. (D) Electron microscopy image of a PSD-95-GFP+ postsynapse facing a presynaptic compartment containing vesicles. The thick arrow shows immunogold labeled PSD-95-GFP proteins; arrow heads show electron-dense thickening of the postsynaptic membrane; thin arrows show presynaptic vesicles. Scale bar = 0.2 μm. (E) Bar graphs and scatter dot plots illustrating the density of PSD-95-GFP+ puncta per 100 μm of dendrites in layer V and ectopic neurons. Values are given as mean ± SEM. t-test, P-value < 0.0001. (F) Confocal images of mCherry+ dendrites and PSD-95-GFP+ puncta from layer V and ectopic neurons. Arrow heads indicate spines devoid of PSD-95-GFP+ puncta. Scale bar = 2 μm. (G) Stacked bar graphs showing the relative percentages of PSD-95-GFP+ puncta on dendritic spines and shafts in layer V and ectopic neurons. (H) Stacked bar graphs showing the relative percentages of PSD-95-GFP+ and PSD-95-GFP− spines in layer V and ectopic neurons.

