Figure 5.
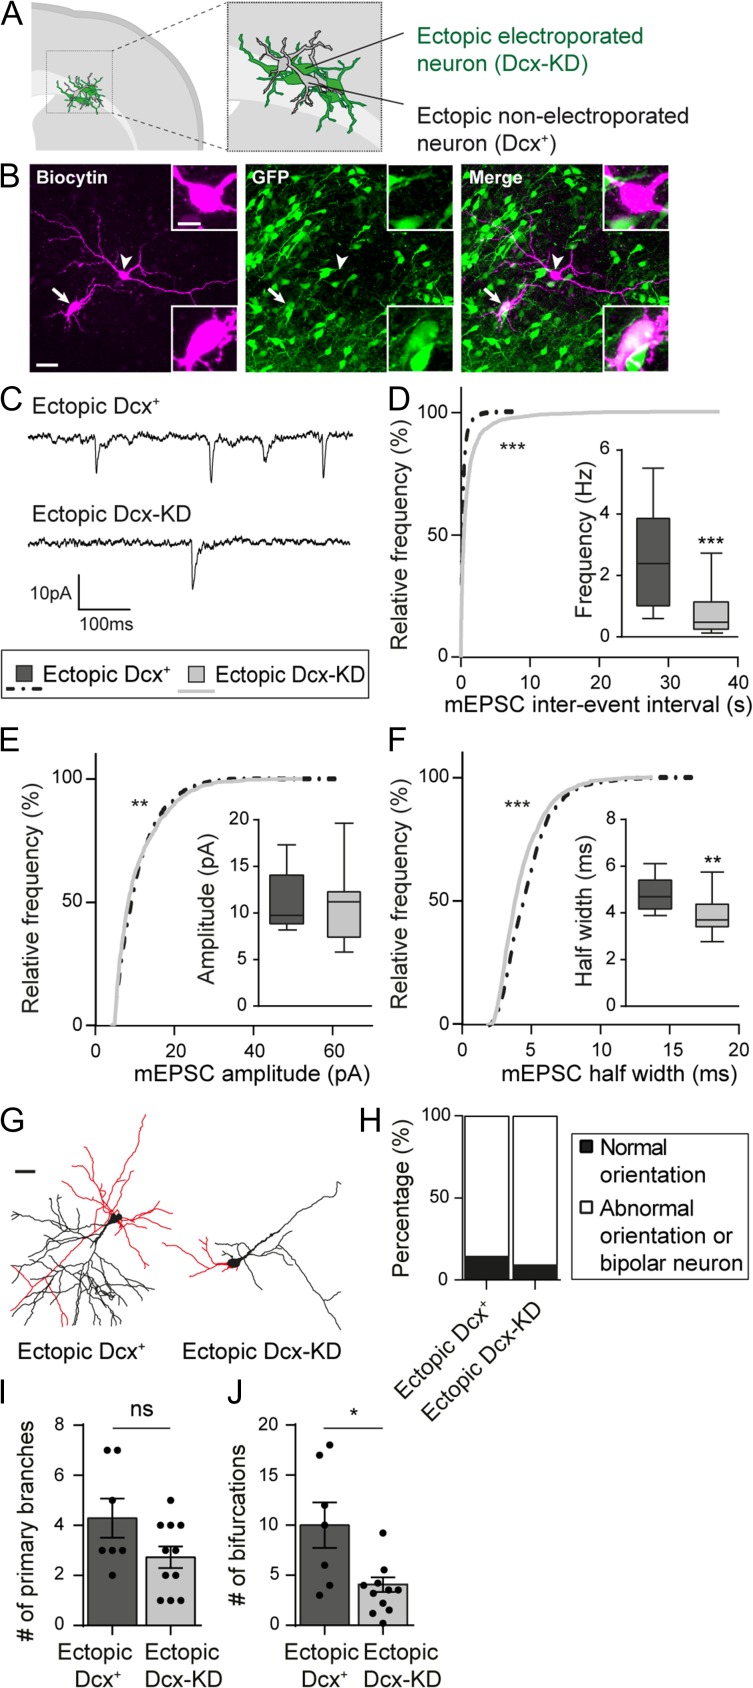
Dcx expression is important for glutamatergic synaptogenesis and dendritic growth. (A) Schematic depicting the presence of non-electroporated ectopic neurons amongst electroporated ectopic neurons. (B) Confocal images of ectopic neurons filled with biocytin during electrophysiological recordings. The arrow indicates an electroporated GFP+ neuron (Dcx-KD) while the arrow head shows a non-electroporated GFP- neuron (Dcx+). Side bar images show higher magnification images of the somas. Scale bars = 30 μm/10 μm. (C) Representative traces of mEPSCs recorded from ectopic Dcx+ and Dcx-KD neurons and analyzed in (D–F). (D–F) Cumulative distributions and box plots of the inter-event interval (D), amplitude (E), and half width (F) values of mEPSCs from ectopic Dcx+ and Dcx-KD neurons. Box limits indicate the 25th and 75th percentiles; whiskers extend to minimum and maximum values; horizontal lines show the medians. Kolmogorov–Smirnov test, (D,F) P-value < 0.0001, (E) P-value = 0.0067; Mann–Whitney test, (D) P-value = 0.0008, (E) P-value = 0.7868, (F) P-value = 0.006. (G) 3D reconstructions of ectopic Dcx+ and Dcx-KD neurons used to analyze their basal dendritic arbor (red) in (I) and (J). Scale bar = 30 μm. (H) Stacked bar graph showing the relative percentages of normally oriented neurons and abnormally oriented or bipolar neurons analyzed in (I) and (J). (I,J) Bar graphs and scatter dot plots showing the mean number of primary branches (I) and bifurcations (J) in ectopic Dcx+ and Dcx-KD neurons. Values are given as mean ± SEM. Each dot represents a neuron. (J) Mann–Whitney test, P-value = 0.027.

