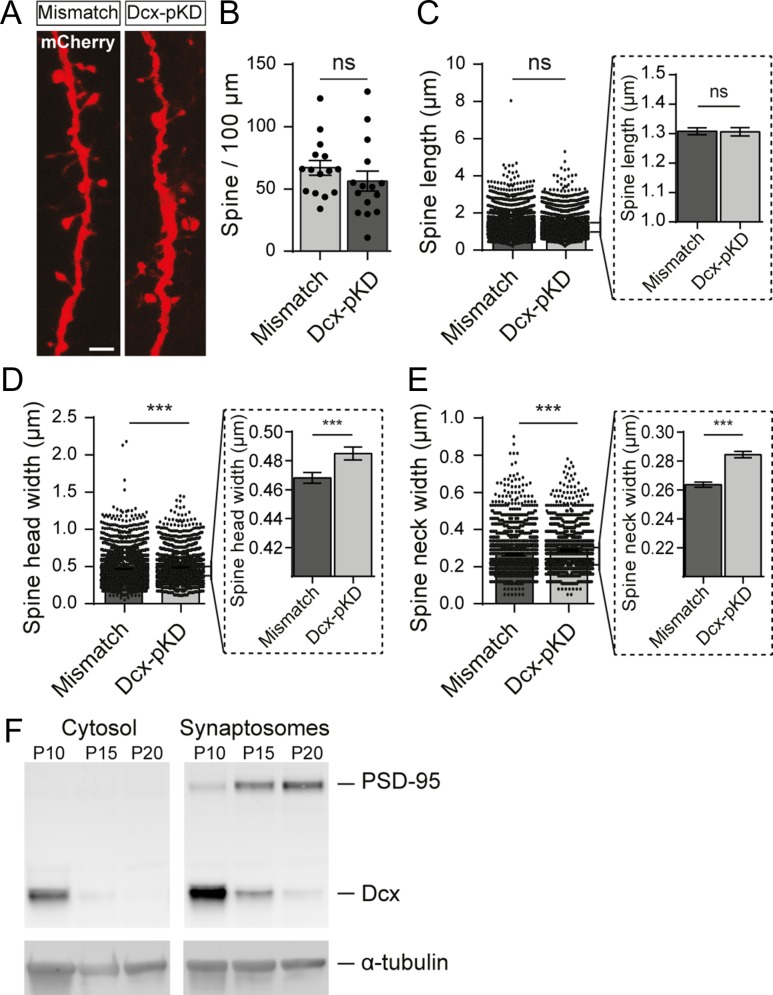
Figure 7.
Postnatal knockdown of Dcx slightly increases dendritic spine head and neck widths. (A) High magnification confocal images of dendritic spines from mismatch and Dcx-pKD neurons co-electroporated with mCherry. Scale bar = 2 μm. (B) Quantification of the density of spines for 100 μm of dendrites in mismatch and Dcx-pKD neurons. Values are given as mean ± SEM. Each dot represents a neuron. (C–E) Bar graphs and scatter dot plots illustrating the mean dendritic spine length (C), head width (D) and neck width (E) in mismatch and Dcx-pKD neurons. Values are given as mean ± SEM. Each dot represents a spine. Dotted line frames hold higher magnifications of the initial bar graphs. (D, E) Mann–Whitney test, P-value < 0.001. (F) Western blot of the synaptosomal and cytosolic fractions isolated from cortices of P10, P15, and P20 non-electroporated rats. (Top panels) Detection of PSD-95 (top) and Dcx (bottom). (Bottom panels) Detection of α-tubulin for control.

