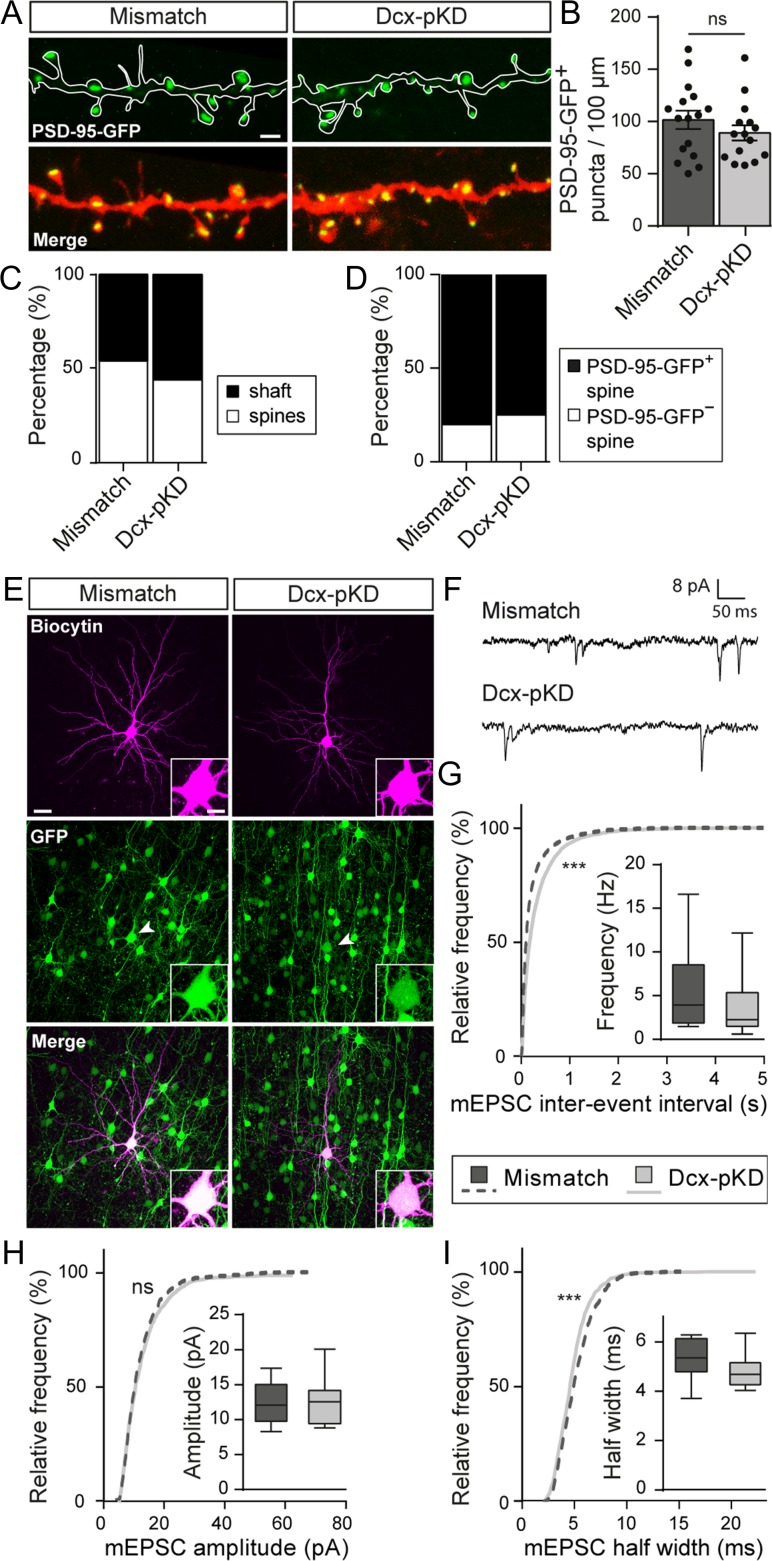
Figure 8.
Miniature excitatory currents are impaired after postnatal knockdown of Dcx. (A) High magnification confocal images of mCherry+ dendrites and PSD-95-GFP+ puncta from mismatch and Dcx-pKD neurons. Scale bar = 2 μm. (B) Bar graph and scatter dot plots illustrating the density of PSD-95-GFP+ puncta per 100 μm of dendrites in mismatch and Dcx-pKD neurons. Values are given as mean ± SEM. Each dot represents a neuron. t-test, P-value = 0.2963. (C) Stacked bar graphs showing the relative percentages of PSD-95-GFP+ puncta on dendritic spines and shafts in mismatch and Dcx-pKD neurons. (D) Stacked bar graphs showing the relative percentages of PSD-95-GFP+ and PSD-95-GFP− spines in mismatch and Dcx-pKD neurons. (E) Confocal images of pyramidal neurons filled with biocytin during electrophysiological recordings. Recorded cells were electroporated neurons as indicated by their GFP+ fluorescence (arrow heads). Insets show higher magnification images of the somas. Scale bar = 30 μm/10 μm. (F) Representative traces of mEPSCs recorded from mismatch and Dcx-pKD neurons and analyzed in (G–I). (G–I) Cumulative distributions and box plots of the inter-event interval (G), amplitude (H), and half width (I) values of mEPSCs from mismatch and Dcx-pKD neurons. Box limits indicate the 25th and 75th percentiles; whiskers extend to minimum and maximum values; horizontal lines show the medians. Kolmogorov–Smirnov test, P-value < 0.0001; Mann–Whitney test, (G) P-value = 0.2539, (H) P-value > 0.9999, (I) P-value = 0.1352.

