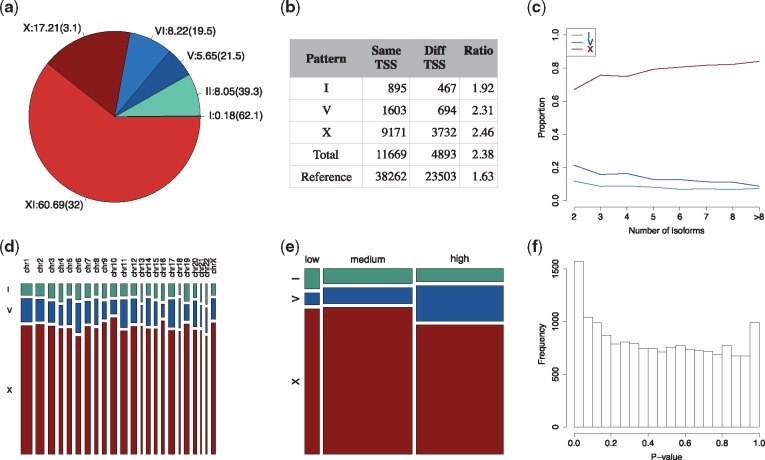
Fig. 2.
ISOP analysis of the MDA-MB-231 dataset. (a) Proportion of isoform patterns and % of isoform patterns within each category that are significant (in parentheses). (b) Frequency of patterns with isoforms with the same and different transcription start site (TSS). (c) Proportion of patterns as a function of the total number of annotated isoforms in the corresponding gene. (d) Proportion of patterns stratified by chromosome. (e) Proportion of patterns stratified by gene expression level. (f) P-value distribution from the test of association between component label and treatment group

