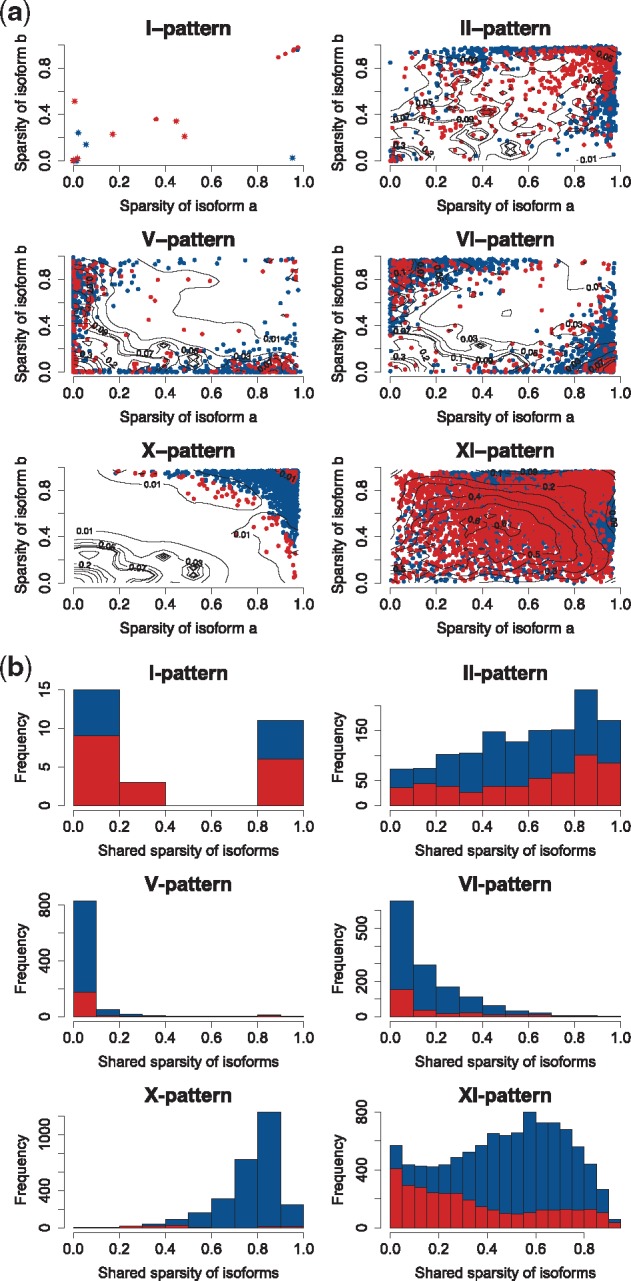
Fig. 3.

Sparsity of isoform expression in principal isoform expression pattern types. (a) Pairwise sparsity of isoform a and b in each individual pair and pattern type. Each point presents a single isoform-pair pattern, while the sparsity of the two isoforms in the pair is indicated on the x- and the y-axes. Blue points and red points represent non-significant and significant isoform-pairs. The star points indicate I-patterns with isoform preference. The contour line presents the two-dimension densities of non-significant isoform pairs using the density smooth function of OCplus package (Ploner et al., 2006). The lower density region indicates the region has a high proportion of significant isoform-pairs. (b) Empirical distribution of the shared sparsity of the two isoforms (directly related to the sparsity of ) in isoform pairs across pattern types. The red part of the histograms corresponds to the portion of significant (non-random) isoform-pairs
