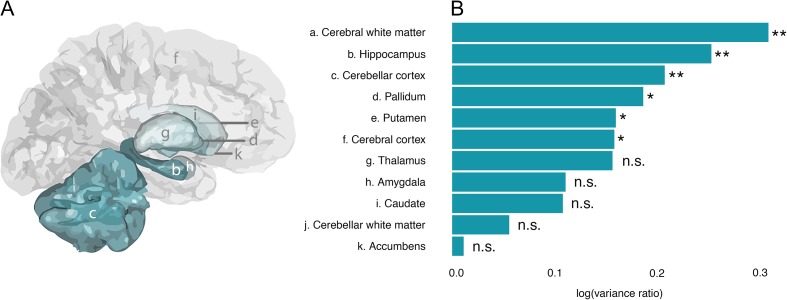
Figure 2.
Greater brain volume variance in males than females. (A) Gray matter ROI are indicated in a, note that cerebral white matter (a) and cerebellar white matter (j) are not displayed. (B) Log transformed variance ratio (x-axis) for all investigated brain regions averaged across hemispheres (y-axis). Variance ratio is estimated as the difference in variance between males and females after adjusting for mean sex difference, scan site, and age. Positive values are indicative of larger variance in males than females, vice versa for negative values. All investigated brain regions showed positive values, that is, larger variance in males. Permutation test (10 000 permutations) showed significant effects for volumes of cerebral white matter, hippocampus, cerebellar cortex, pallidum, putamen, and cerebral cortex. **P < 0.05; *P < 0.01; n.s., non significant.

