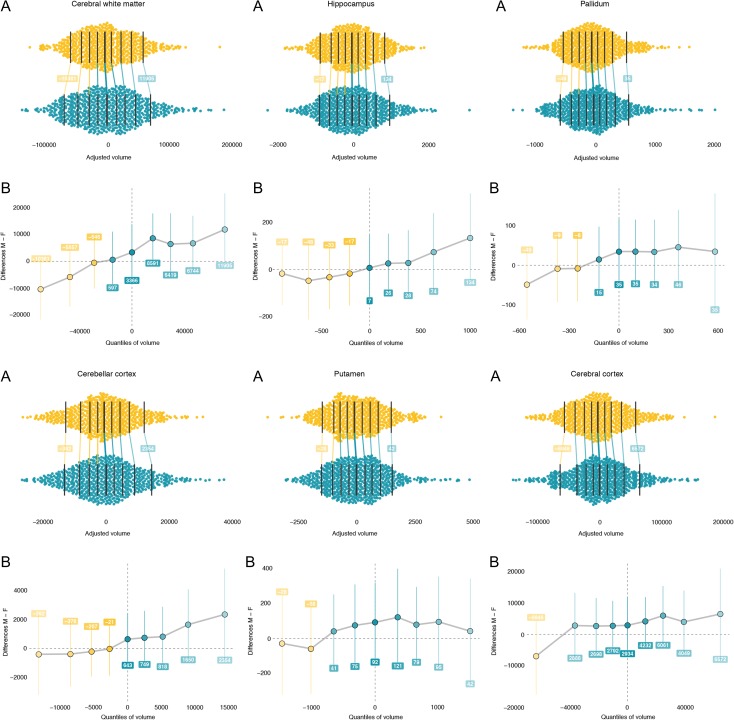
Figure 3.
Greater brain volume variability for males than females in both upper and lower extremities of distributions for volumes adjusted for age, scan site, and mean sex difference for cerebral white matter, hippocampus, pallidum, cerebellar cortex, putamen, and cerebral cortex. (A) Panels shows spread difference in volume (in mm3, x-axis) distributions of females (yellow) and males (green) are illustrated using jittered scatterplots. The vertical lines mark the deciles for each sex with the median indicated by the thicker middle line. Because of the difference in spread the first decile of each volume is lower for males than females (indicated with a yellow line) while the nineth decile is larger for males than females (indicated with a green line). The values of the differences (adjusted volumes) for deciles 1 and 9 are indicated in the superimposed labels. Panels B focus on the proportion of the A panels marked by the gray shaded box. Shift functions (95% bootstrap CI) x-axis values match male volumes for each decile in panel A. The y-axis shows the difference compared with females for each decile. The superimposed labels indicate how much each decile should be shifted for females to match males. Dotted lines indicate difference between the medians of males and females (distance at quantile 0.5). All curves show greater male variability at both extremities as indicated by the positive values on the right and negative values on the left.

