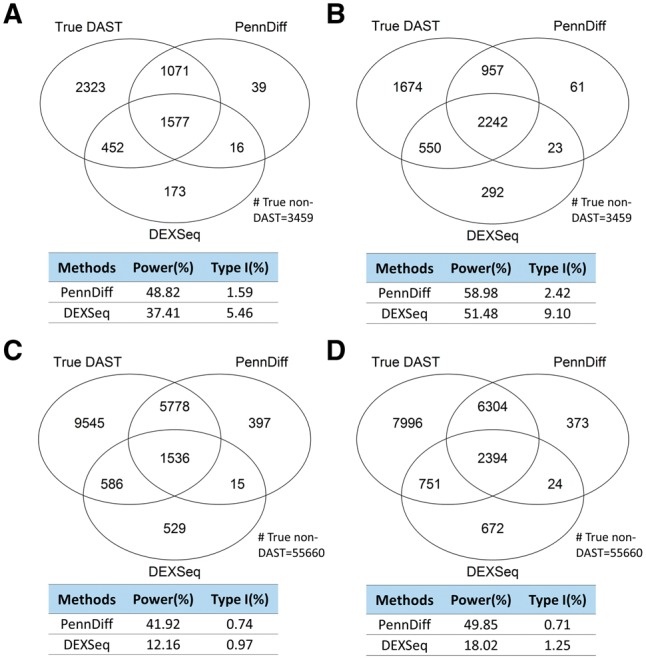
Fig. 3.

Type I error and power of exon-based methods with different sample sizes and gene annotations. Calculations were based on all DAST and non-DAST exons in the input data. Significance was evaluated at the 5% significance level. An exon with true exon-inclusion level difference > was defined as a true DAST exon. (A) 5 versus 5 based on RefSeq annotation. (B) 20 versus 20 based on RefSeq annotation. (C) 5 versus 5 based on Ensembl annotation. (D) 20 versus 20 based on Ensembl annotation
