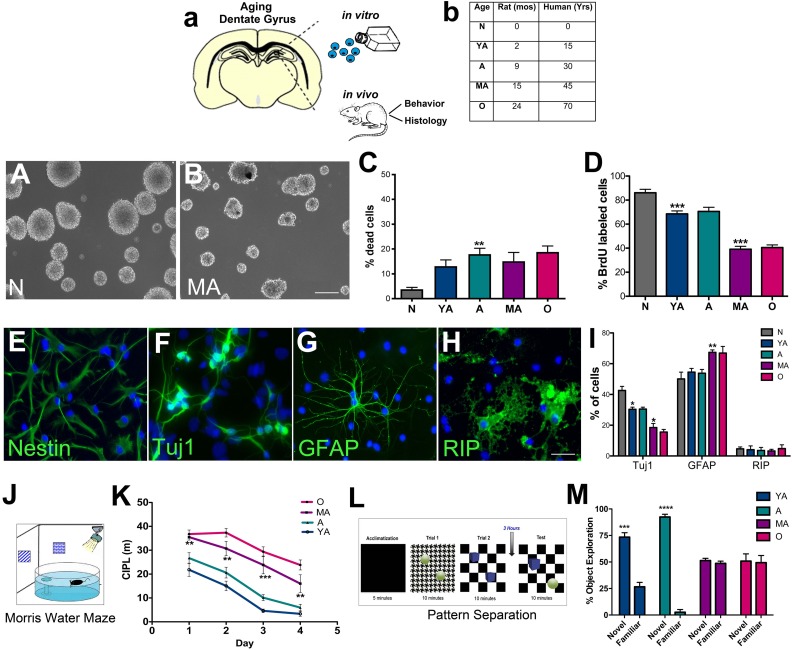
Fig. 1.
In vitro characterization and related behavioral analysis of hippocampal NSPC survival and regenerative function across age. The schematic in (A) depicts the experimental design. The main age-groups of rats (with corresponding human years) used in the study are shown in (B). NSPCs were cultured from these rats for in vitro studies, and the animals were also behaviorally and histologically assessed. A–B are representative phase-contrast images of newborn and middle-aged NSPCs grown as neurospheres in culture. In vitro analysis of viability and proliferation via live-dead and BrdU assays are shown in C and D (C; p < 0.01, YA versus A: D; p < 0.001, YA versus A and A versus MA; One-way ANOVA with Tukey’s post-hoc test). E–H show examples of undifferentiated NSPCs (E, nestin+) and NSPCs which differentiated into Tuj1+ neurons (F), GFAP+ astrocytes (G) and RIP+ oligodendrocytes (H). The graph in I shows quantification of this capacity across the five age-groups in (Tuj1+- p < 0.05, N versus YA; p < 0.05, A versus MA, one-way ANOVA with Tukey’s post-hoc test; GFAP+- p < 0.01, A versus MA, one-way ANOVA with Tukey’s post-hoc test). The diagram in J shows the Morris water maze behavior analysis set-up and K depicts the results of the task conducted on the different age-groups of rats (K; A versus MA, Two-way RM-ANOVA with Tukey’s post-hoc test). Similarly, the experimental set-up of the pattern separation task is shown in L, and results are in M (YA p < 0.001 and A p < 0.0001, unpaired t tests). *p < 0.05, **p < 0.01, ***p < 0.001. Scale Bars: A: 50 µm, B: 200 µm, E–H: 20 µm. A: adult; ANOVA: analysis of variance; BrdU: bromodeoxyuridine; GFAP: glial fibrillary acidic protein; MA: middle-aged; NSPC: neural stem progenitor cell; YA: young adult.

