Fig. 2.
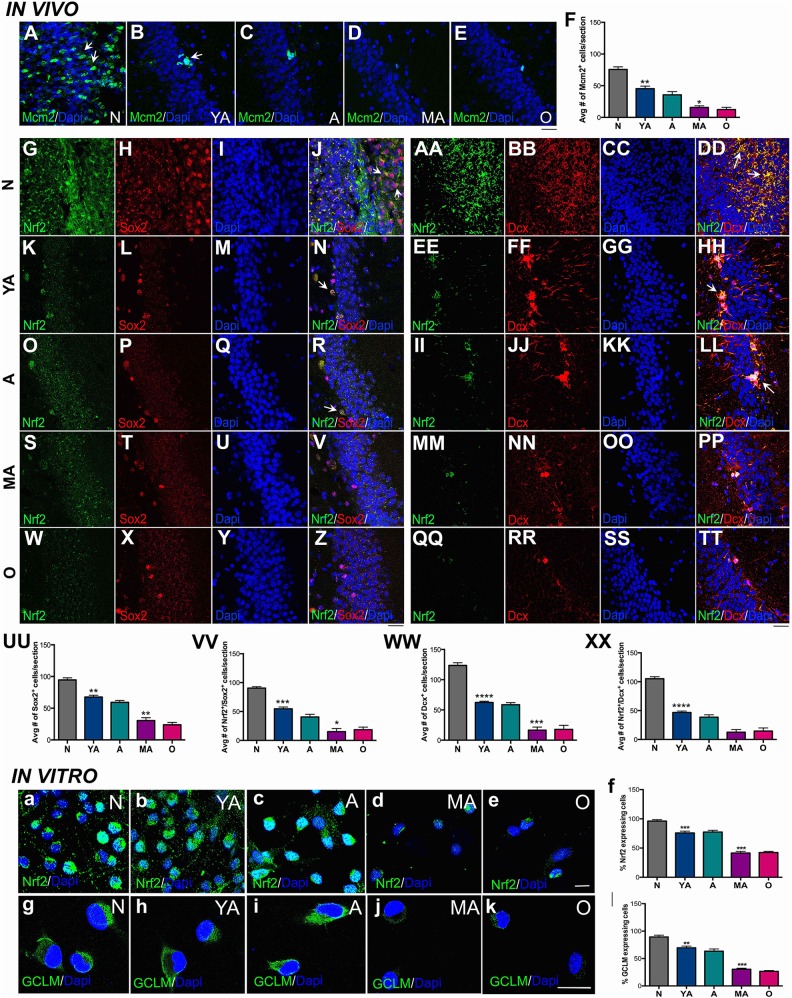
Correlation of decline in DG NSPC regeneration to Nrf2 expression. Immunohistochemical analysis by age group (N, YA, A, MA and O) illustrating MCM2 staining (for proliferation) in A–E and its quantification is in F (p < 0.01, N versus YA and p < 0.05, A versus MA; one-way ANOVA with Tukey’s post-hoc test). Qualitative assessment of hippocampal Sox2+ NSPCs and their expression of Nrf2 across the five age-groups is in G–Z, with quantification in UU (p < 0.01, N versus YA and p < 0.01, A versus MA; one-way ANOVA with Tukey’s post-hoc test), and VV (p < 0.001, N versus YA and p < 0.05, A versus MA; one-way ANOVA with Tukey’s post-hoc test) are shown. Similarly, qualitative and quantitative analysis of Dcx+ cells is in AA–TT, WW (p < 0.0001, N versus YA and p < 0.001, A versus MA; one-way ANOVA with Tukey’s post-hoc test) and XX (p < 0.0001, N versus YA and p < 0.01, A versus MA; one-way ANOVA with Tukey’s post-hoc test). Expression of Nrf2 and GCLM in cultured hippocampal NSPCs across the five age-groups is shown in a–e and g–k, with quantification in f (p < 0.001, N versus YA and p < 0.001, A versus MA; one-way ANOVA with Tukey’s post-hoc test) and l (p < 0.01, N versus YA and p < 0.001, A versus MA; one-way ANOVA with Tukey’s post-hoc test). *p < 0.05, **p < 0.01, ***p < 0.001. Scale bars: A–E; G–Z, AA–TT: 25 µm, a–e: 15 µm. A: adult; ANOVA: analysis of variance; DG: dentate gyrus; N: newborn; GCLM: glutamate–cysteine ligase modifier subunit; MA: middle-aged; NSPC: neural stem progenitor cell; O: old; YA: young adult.

