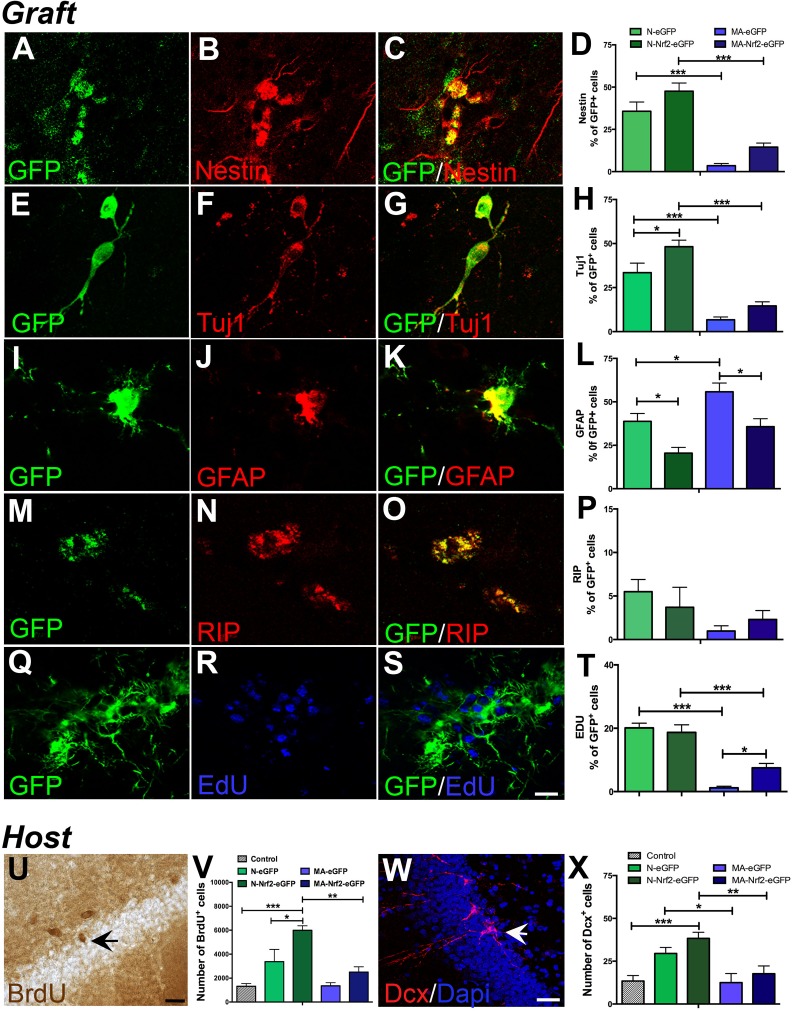
Fig. 6.
Quantification of grafted NSPC phenotype and the induction of host DG plasticity. Examples of grafted (GFP+) undifferentiated NSPCs (nestin+, A–C) and their differentiation into Tuj1+ neurons (E–G), GFAP+ astrocytes (I–L), and RIP+ oligodendrocytes (M–O). The quantifications of nestin, Tuj1, GFAP and RIP expressing cells within the newborn and middle-aged grafts are in D, H, L, P. Graft proliferation, assessed via the quantification of EdU incorporation, is in Q-T. On the other hand, host DG NSPC proliferation was examined via BrdU labeling (example in U). Stereological quantification of host BrdU+ cells in various NSPC transplanted groups is shown in the graph in V. Dcx+ neuroblasts (example in W) were enumerated in the host DG (in X). *p < 0.05, **p < 0.01, ***p < 0.001, one-way ANOVA with post-hoc Tukey’s tests. Scale bars: A: 20 µm; U, W: 30 µm. ANOVA: analysis of variance; BrdU: bromodeoxyuridine; Dcx: doublecortin; DG: dentate gyrus; EdU: 5-ethynyl-2’-deoxyuridine; GFAP: glial fibrillary acidic protein; GFP: green fluorescent protein; NSPC: neural stem progenitor cell.

