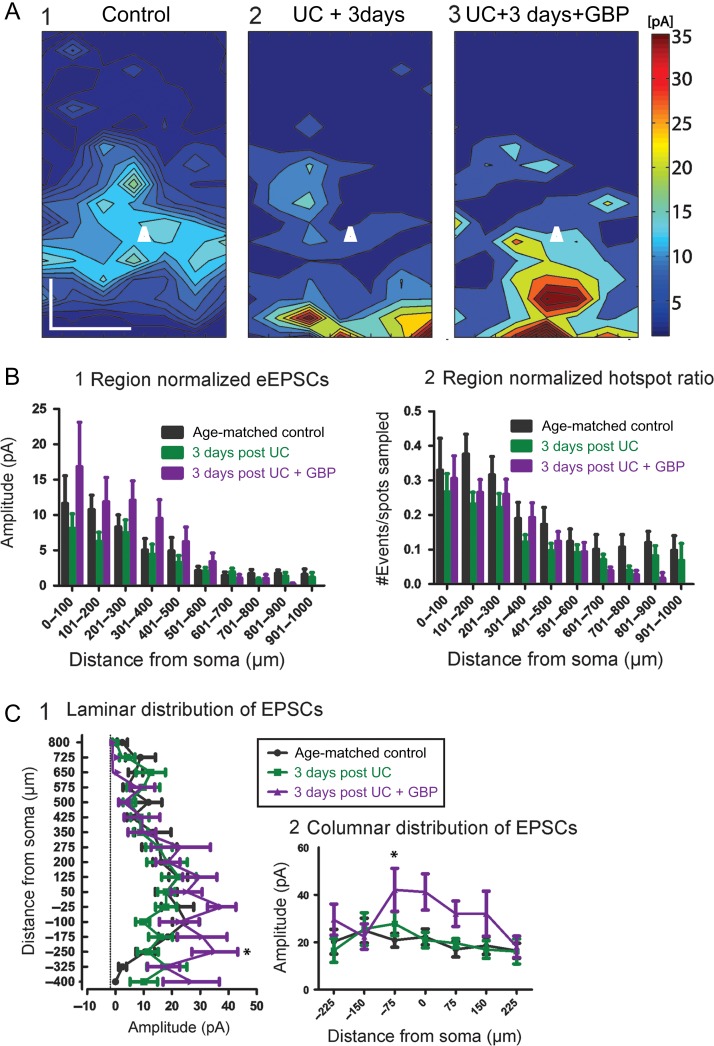
Figure 1.
Cumulative amplitude maps 3 days after UC. (A) Composite maps of cumulative EPSCs evoked by LSPS. Pia oriented up, and cell location in layer Va represented by white triangle. Composite maps were made by averaging connectivity maps from all cells within a group with respect to laminar orientation and cell location. An increase in the evoked amplitude is seen most prominently in the UC group treated with GBP (A3) versus control (A1) and 3 days postUC (A2). Scale bar, 200 × 200 μm. (B) Modified Sholl analyses of region-normalized EPSC amplitudes (B1) and region-normalized hot spot ratios (B2). Normalized EPSC amplitude reflects the strength of connections within each Sholl region, normalized to the number of grid locations sampled. The hot spot ratio is the number of hot spots divided by the number of grid locations sampled per Sholl region. The Sholl analyses were similar overall between groups, with the GBP-treated group trending towards larger amplitudes, (C) Laminar (C1) and columnar (C2) distributions show significantly larger cumulative EPSCs from GBP-treated group (*P < 0.05).

