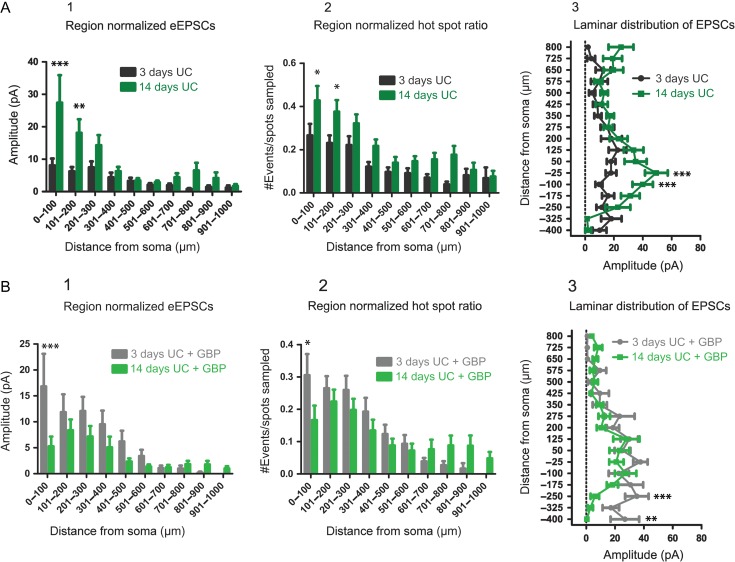
Figure 5.
Comparison of connectivity over time. (A) Region-normalized EPSC amplitude (A1), hot spot ratio (A2), and laminar analyses (A3) comparing connectivity at 3 days after UC (black) and 14 days after UC (green). Overall, excitatory connectivity increases in layer V (0–300 μm) over this time period. (B) Similar analyses comparing evoked EPSCs (B1), hot spot ratios (B2) and laminar distribution of EPSC amplitude (B3) for GBP-treated UC rats 3 days (gray) and 14 days (green) after UC. Overall, connectivity is decreased at 14 days versus 3 days after UC by GBP treatment.

