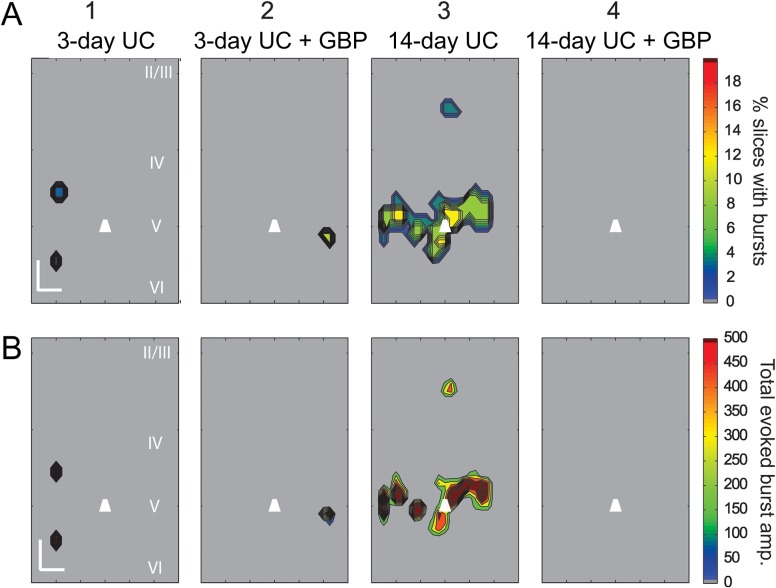
Figure 7.
Composite LSPS-evoked Burst Maps. (A) Composite burst maps showing the percentage of slices with LSPS-evoked bursts in layer V Pyr neurons 3 and 14 days after UC, in animals treated with saline (A1, 3) or GBP (A2,4) (n = 20 slices from eight 3-day UC animals; n = 15 slices from five 3-day UC + GBP animals; n = 19 slices from four 14-day UC animals; n = 19 slices from five 14-day UC + GBP animals). Note that the largest proportion of bursts were evoked within layer V from saline-treated 14-day UC animals (A3, B3), and no bursts were evoked in 14-day UC animals treated with GBP (A4, B4). (B) Composite maps showing the average cumulative EPSC amplitudes of evoked burst activity (same data set as in A). Calibration in B1:200 μm. EPSC amplitude (right heat bar) in pA.

