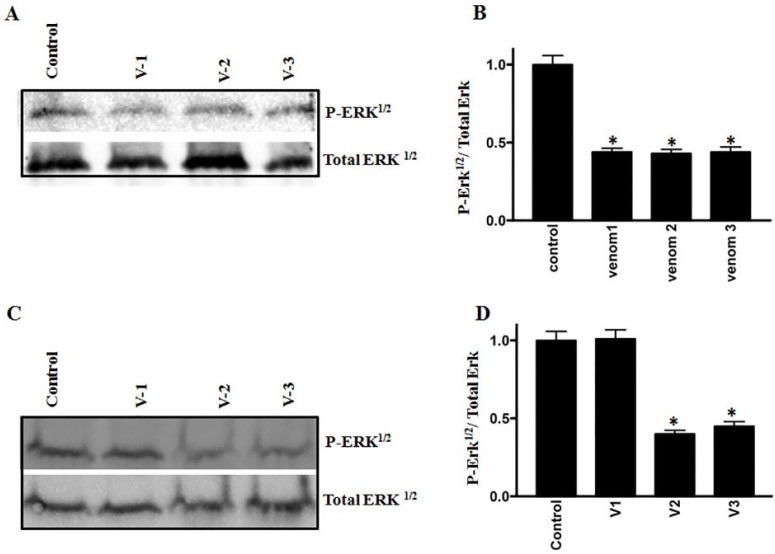
Figure 4.
Western blot analyses show the phosphorylation of Erk1/2 on colorectal (A) and breast (C) cancer cell lines. Columns (B and D) show the densitometric analysis of the phosphorylated Erk with corresponding total Erk (P < .05). Extent of inhibition was more pronounced in the colorectal cancer cell line as compared with breast cancer cell line.

