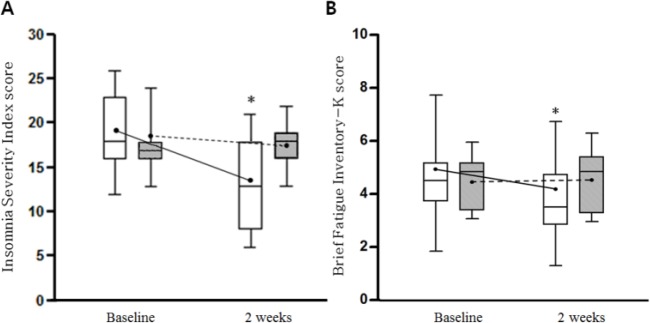
Figure 2.
Changes in the ISI (A) and BFI (B) scores in the GGBT and wait-list groups. The ends of whiskers represent the upper and lower limit of the values and columns represent 25th and 75th percentile with the median value. The connecting lines represent changes of mean values. *Represents change that was statistically significant (P < .05). White columns represent GGBT group, whereas gray columns represent wait-list group. ISI, Insomnia Severity Index; BFI, Brief Fatigue Inventory; GGBT, Gamiguibi-tang.

