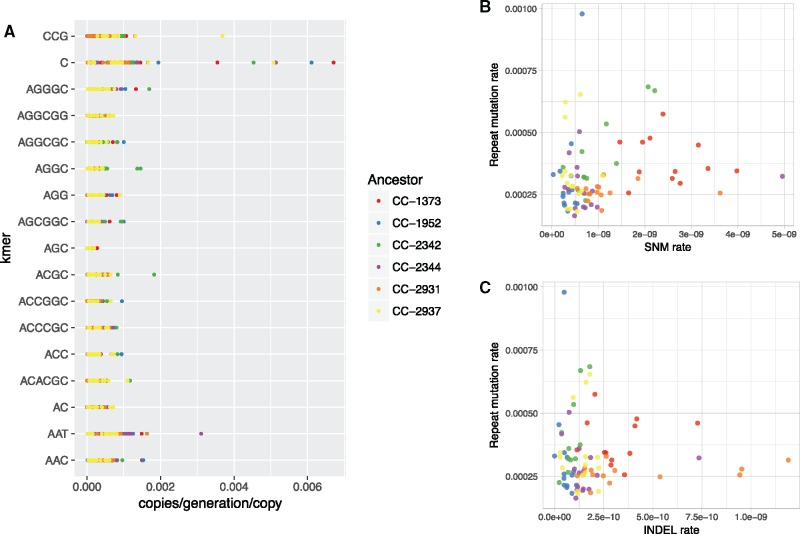
Fig. 4.
—Variation in mutation rates. (A) Normalized expansion/contraction rates of 17 high-abundance kmers in all strains. ANOVA analysis did not suggest a significant difference in mutation rate between ancestors or kmer sequences. (B) No significant relationship between single nucleotide mutation (SNM) rate and repeat expansion/contraction rate. (C) No significant relationship between indel rate and repeat expansion/contraction rate. Each point is the mutation rate of a different MA line, color-coded by ancestral strain. SNM and indel rates are from Ness et al. (2015).

