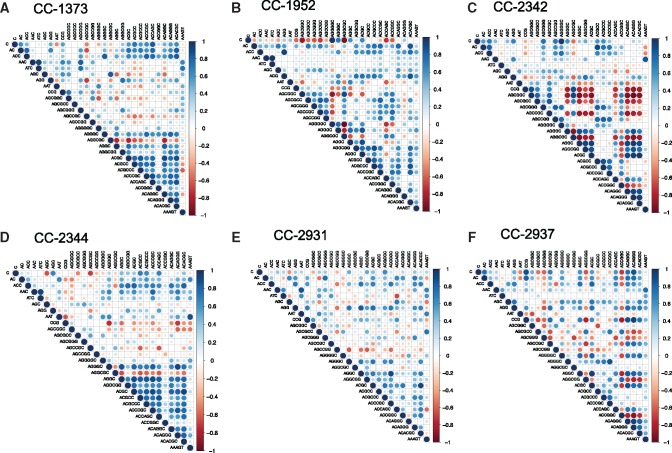
Fig. 5.
—Correlation of changes in repeat copy number. Kmers are ordered by relatedness based on figure 3, and ordering is the same in each diagram for each MA ancestor. Input data to these correlations plots were matrices of mutation rate for each kmer in each MA line of the given strain.

