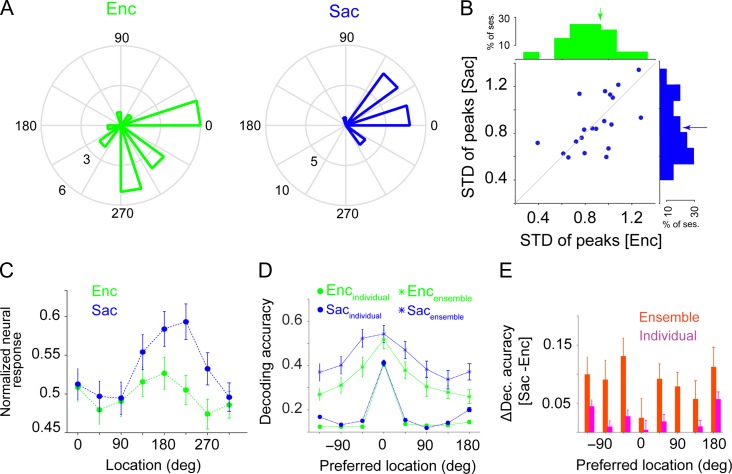
Figure 3.
The presaccadic expansion is not due to different ranges of tuning preferences or changes in the preferred location of neurons between visual encoding (Enc) and saccade preparation (Sac). (A) Distribution of the preferred locations (peak of the tuning curve) of individual neurons for one example session. (B) Plot shows the standard deviation of the preferred locations for all neurons in a given session during Sac vs. Enc. Upper and right-hand plots show the histograms of the standard deviation of the preferred locations during each epoch. There was no significant difference in the range of tuning preferences between Enc and Sac. (C) Normalized response of 188 FEF neurons (single-units) to targets presented at different angles relative to the neuron’s preferred location during Enc and Sac. The x-axis shows the actual angular position of the target. The error bars represent s.e.m. (D) Encoding expansion in ensembles of units with less than 90 degrees change in the preferred location. Plot shows the decoding accuracy of the SVM classifier for various locations for individual units (circles) and ensembles (stars) of units which have less than 90 degrees change in their preferred location between Enc and Sac, during the Enc (green) and Sac (blue) epochs. (E) The change in decoding accuracy in (D) between visual encoding and saccade preparation for individual units (pink) and the ensembles of units (red) as a function of target locations.

