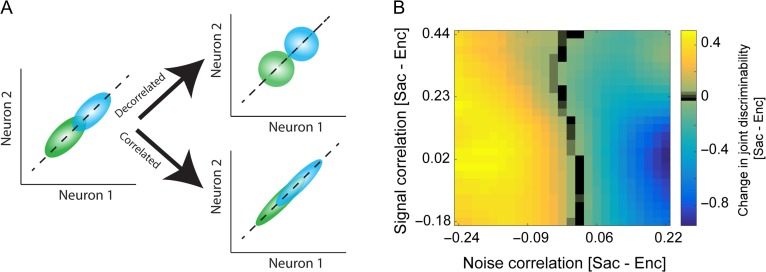
Figure 9.
Presaccadic change in joint discriminability as a function of changes in SC and NC. (A) Effects of changes in inter-neuronal correlations on the discriminability of paired neural responses. Plot shows an idealized response of 2 neurons with positive signal and noise correlations to the target at 2 different locations (green and blue), and ellipses represent the variability of the neural response. (B) Change in joint discriminability was explained by a reduction in noise correlation when the change in signal correlation was taken into account. The change in joint discriminability (separately z-scored across the same change of signal correlation, each row) is plotted as a function of the changes in signal and noise correlations.

