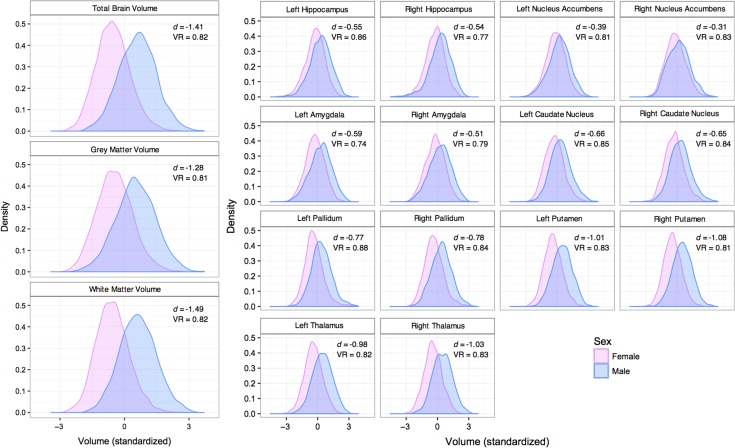
Figure 1.
Density plots of sex differences in overall brain volumes (left section) and subcortical structures (right section). d = Cohen’s d (mean difference); VR = Variance Ratio (variance difference). All mean differences were statistically significant at P < 3.0 × 10⁻²⁵, all variance differences were significant at P < .003, after correction for multiple comparisons (see Table 1).

