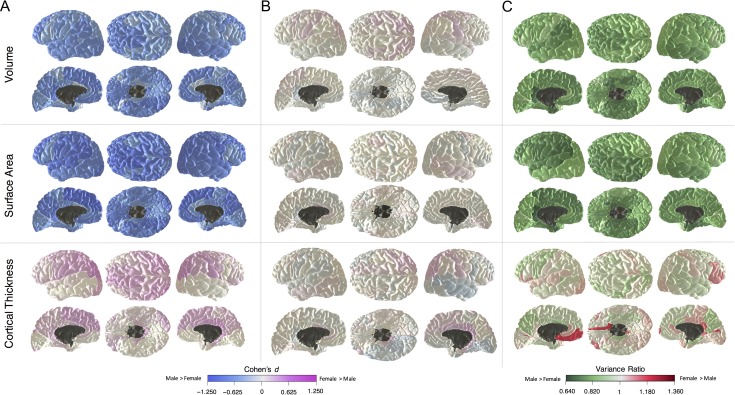
Figure 2.
Sex differences across the subregions in volume, surface area, and cortical thickness. Shown are (A) mean differences, (B) mean differences adjusted for total brain volume, total surface area, and mean cortical thickness (respectively by column); and (C) variance differences. Adjusted variance differences were near-identical to those shown in (C); see Figure S5. See Figure S3 for subregional atlas.

