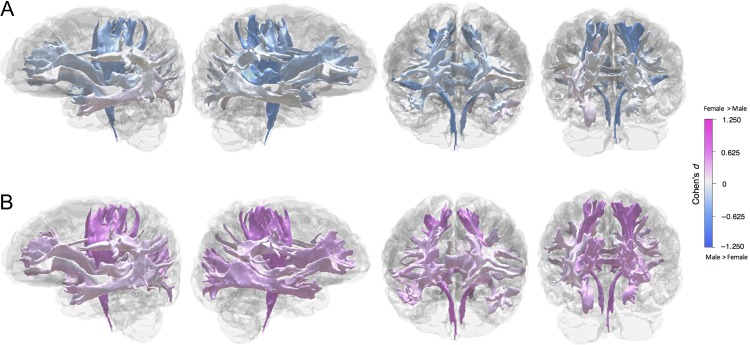
Figure 3.
Mean sex differences in white matter microstructural measures (A) fractional anisotropy and (B) orientation dispersion across 22 white matter tracts. For both measures, numerically the largest effect was found in the right cortico-spinal tract. See Figure S4 for tract atlas.

