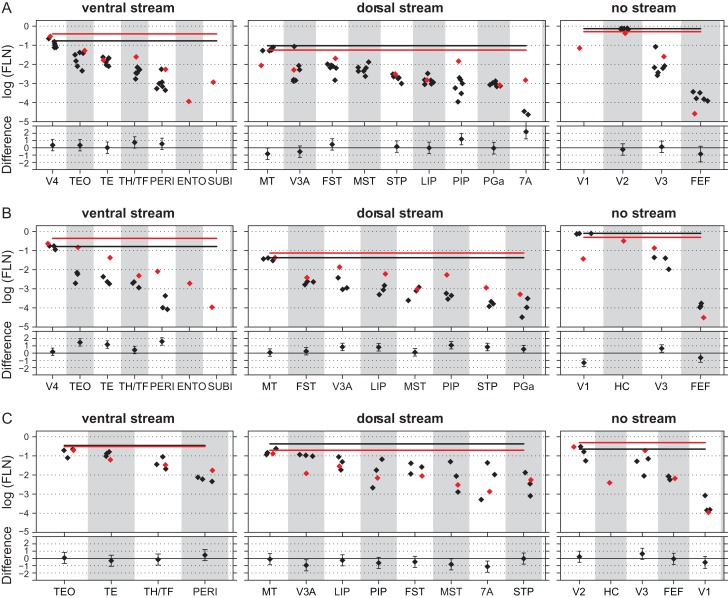
Figure 5.
Effects of enucleation on a widespread increase in FLN values to projections to HC and area V2 but not to area V4. Enucleates, red diamonds; normal controls, black diamonds. Mean cumulative sum of functional stream areas, enucleate red line; normal, black line. Upper part, log scale barchart of the fraction of labeled neurons (FLN); lower part, estimated difference and 95% confidence interval (intervals that do not include zero indicate significant differences). (A) Injections in normal striate cortex representing the central area V1 and equivalent regions in hybrid cortex (BB181 HC; 1 enucleate, 6 normals). (B) Injections in area V2 (1 enucleate, 3 normals). (C) Injections in area V4 (3 enucleate, 1 normal). For abbreviations of area names see glossary.

