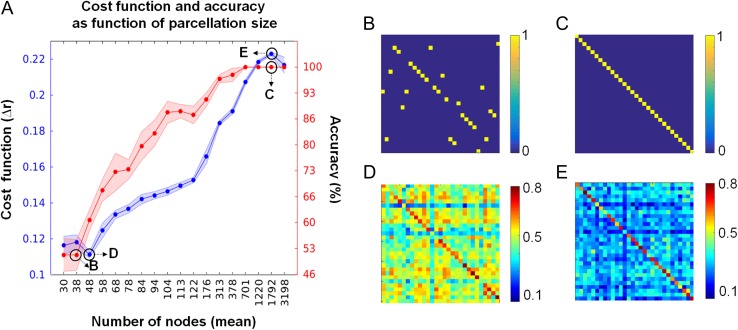
Figure 1.
Cost function and accuracy in relation to parcellation size. (A) Red markers (right y-axis) show mean accuracy, measured as the fraction of correctly identified subjects (average of 10 random parcellations). Red-shaded areas correspond to +/− 1 standard deviation. Blue markers (left y-axis) show the mean cost function, measured as the difference between the main diagonal and the off-diagonal of the similarity matrix, normalized by the number of elements in the matrix (average of 10 random parcellations). Blue-shaded areas correspond to +/− 1 standard deviation. Black upper-case letters within the graph refer to panels on the right (data from 1 random parcellation). (B–E) Similarity matrices obtained by correlating the subjects’ FCv of session 1 and 2. Accuracy was computed as the number of elements that fall within the main diagonal of the similarity matrix. In panels (B) and (C) the accuracy is at 50 and 100%, respectively. Panels (D) and (E) show the Pearson correlation matrices corresponding to networks of 48 and 1792 nodes (low and high values of the cost function), respectively.

