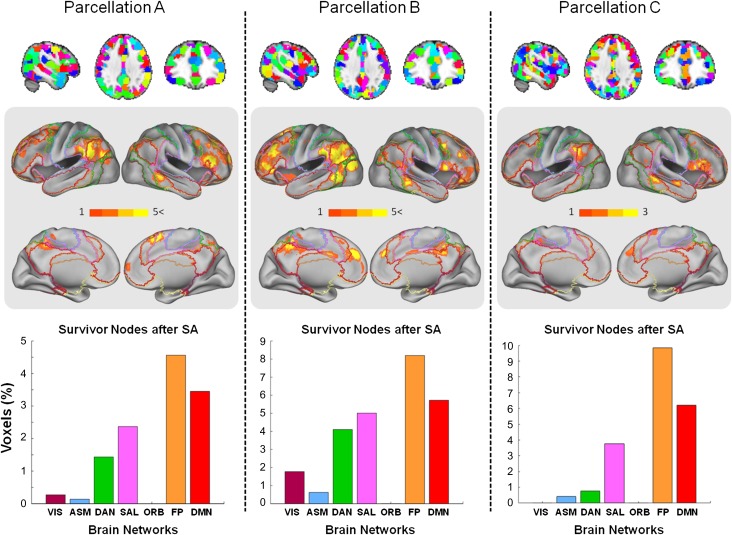
Figure 2.
SNs (global fingerprints) obtained from SA on whole-brain data. Columns show results from 3 different whole-brain parcellations. Parcellations A, B, and C comprising 382, 322, and 701 parcels, respectively, are shown in the upper row. The middle row shows surface projections of the SNs (fingerprints) on the brain aggregated over ten SA runs on parcellations A and B, and 3 SA runs on parcellation C. The color bar represents the number of runs that a given brain node survived the SA procedure. Surface projections of the 7 RSNs from Yeo et al. (2011) are superimposed as outlines. The histograms in the bottom row indicate the fraction of SNs (normalized by size of network) averaged across all the repetitions of the SA. Surface projections use the PALS approach of Van Essen (2005). See text for abbreviations of brain networks.

