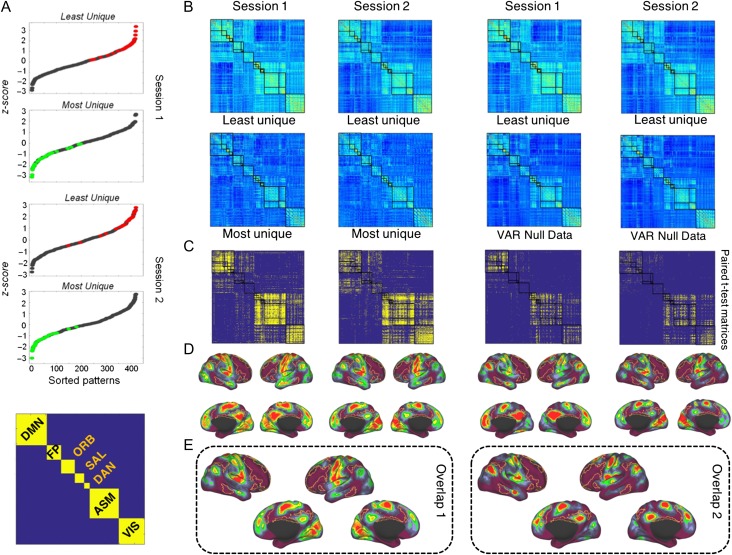
Figure 5.
Temporal expression of fingerprints. (A) Sorted similarity z-score values of FC patterns of all 14 time windows of each subject for sessions 1 and 2. Green and red markers indicate the minimum and maximum similarity values, respectively. In the bottom, it is shown the matrix organization of the RSN used to display the FC patterns and the statistical maps. (B) Most unique and least unique FC snapshots, corresponding to patterns with lowest and highest similarities across all windows and all subjects, respectively. The average of most/least unique features corresponds to the green and red markers in panel A. In the second row (third and fourth columns), are shown the average FC patterns corresponding generated by the VAR model. (C) Significant differences (P < 0.05, FDR-corrected, paired t-test) of the links between the most and least unique patterns in both sessions (first and second columns) and the most and null data patterns (third and fourth columns) in both sessions. The color map represents P-values. Hot colors indicate that FC connections (averaged across subjects) are greater for the least unique compared with the most unique patterns and compared with the null data. (D) Brain projection of the significant links in both sessions for both comparisons. The color map indicates the extent of similarity of FC connections across subjects. Hot colors indicate a high degree of similarity. The FP network is outlined on the surface. It exhibits low values, indicating (consistent with previous analyses; see Figs 2 and 3) that this network aggregates a large number of dissimilar (less consistent, more variable) links across subjects. (E) Overlapping maps of the sessions from the comparisons between “least unique” versus “most unique” (overlap map 1, spatial correlation value of 0.68) and from the comparisons between “least unique” versus “null data” (overlap map 2, spatial correlation value of 0.93). The overlapping maps show that highly similar significant connections are mainly located outside of the FP and ORB network.

