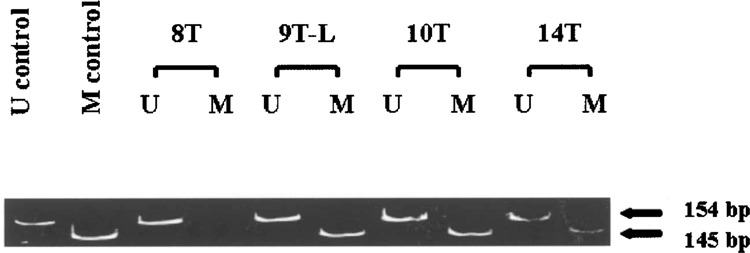
Figure 3.

Representative methylation-specific PCR. The 145-bp band corresponds to the methylation-specific PCR product (M) and the 154-bp band corresponds to the unmethylated PCR product (U). Tumor #8 (T8) demonstrates amplification with only the unmethylated-specific primers indicating no 5′ CpG methylation. Tumors #9L, 10, and 14 (T9-L, T10, and T14) demonstrate amplification using both unmethylated and methylation-specific primers and represent specimens harboring p16 methylation.
