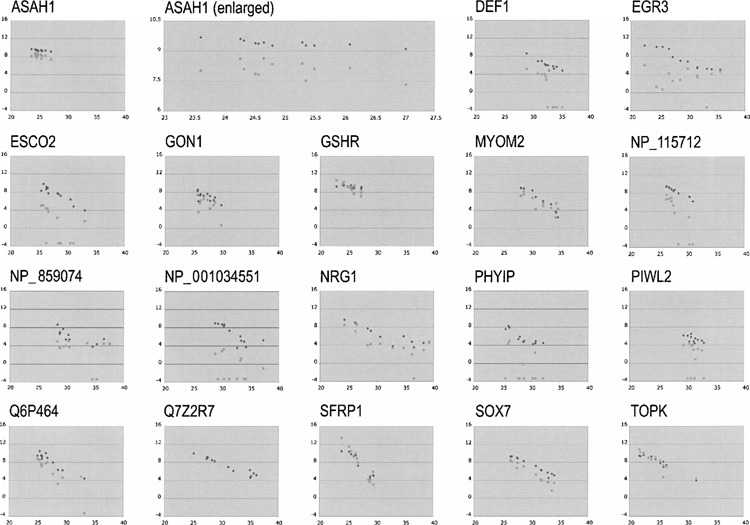
Figure 3.

Correlation between the band intensity obtained from the SM RT-PCR or fluorescence intensity obtained from DNA microarray hybridization and the Ct values obtained from the real-time qRT-PCR experiments. The log2 values of the band intensity and fluorescence intensity were calculated and plotted along the y-axis with black diamonds and gray squares, respectively, against the Ct values on the x-axis. The ASAH1 gene was used as a control, because this gene was ubiquitously expressed in large quantity in all the cells and tissues that were examined in both the SM RT-PCR and the DNA microarray hybridization experiments. Negative and zero values obtained by micro-array hybridization experiments were assigned the value of 0.1 for these graphs. The portion of the ASAH1 results was enlarged and is also shown on the top row.
