
Figure 2.
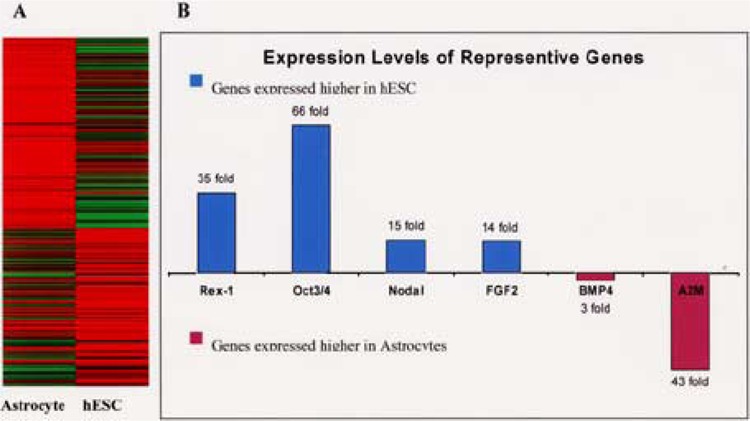
Differential gene expression between pluripotent hESC and hESC-derived astrocytes. (A) There are 684 differentially expressed genes between hESC and astrocytes derived from hESC. The gene expression levels are presented as an expression heatmap. Red: high; yellow: medium; green: low. (B) Expression levels of representative genes are shown with fold difference, which is calculated as described in Materials and Methods.