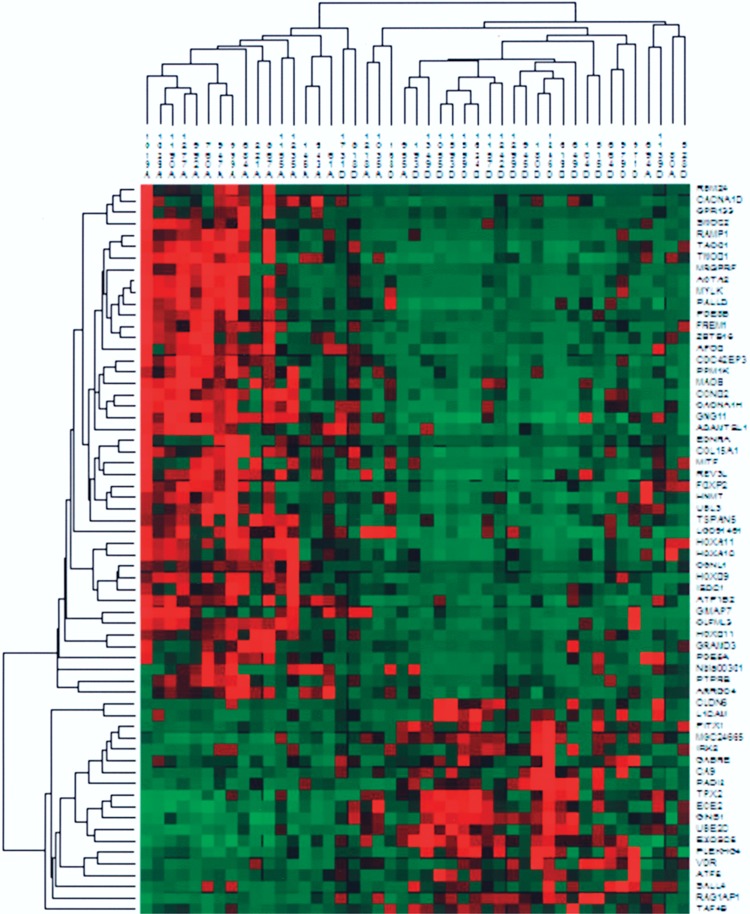
Figure 2.

Hierarchical clustering of all 45 tumors based on 64 differentially expressed genes (p < 0.001; FC > 2; see also Tables 2 and 3). Green represents negative values compared to the reference; red represents positive values; and black represents 0. Two clusters are formed; one comprising 18 tumors, 16 from survivors (A) and 2 from nonsurvivors (D), whereas the other cluster comprises 27 tumors, 5 from survivors and 22 from nonsurvivors.
