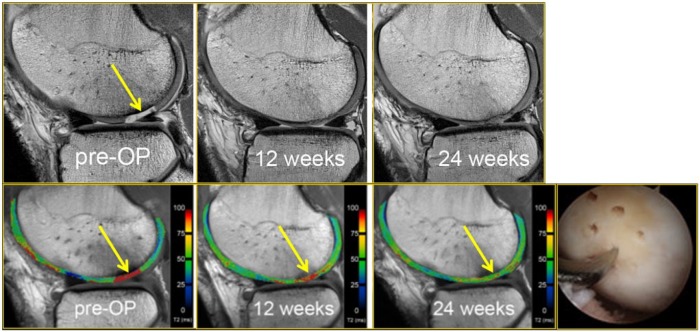
Figure 3.
A 25-year-old male soccer player who received microfracture surgery of a cartilage lesion (yellow arrow, preoperative image). Arthroscopic image shows an arthroscopic awl at the site of lesion microfracture. Pre- and postoperative T2-mapping images show how T2 values change longitudinally, demonstrating the maturation of the repaired cartilage (yellow arrows, 6 weeks and 24 weeks postoperatively) with decreasing free water content and thus decreasing T2 values during the longitudinal follow-up. The patient returned to play 8 months after surgery.

