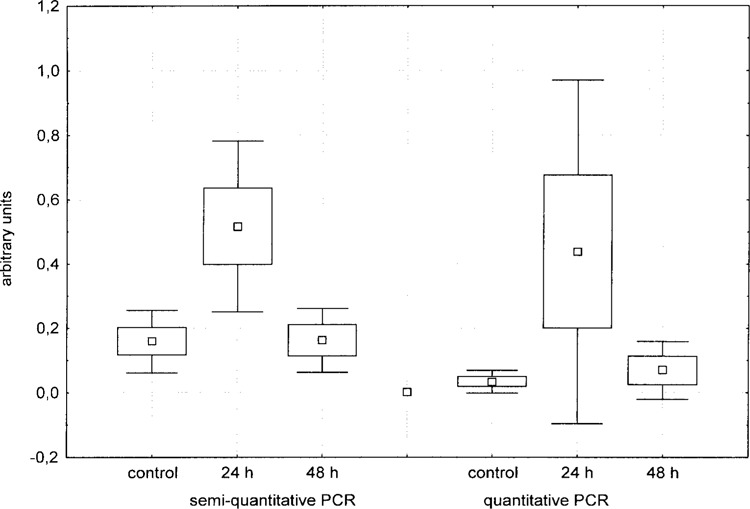
Figure 3.

Box and whisker diagrams describing means, SEs, and SDs of hepcidin expression in the liver of control and LPS-treated animals. Hepcidin expression was evaluated by semiquantitative and real-time RT-PCRs and both techniques produced a similar trend.
