Figure 2.
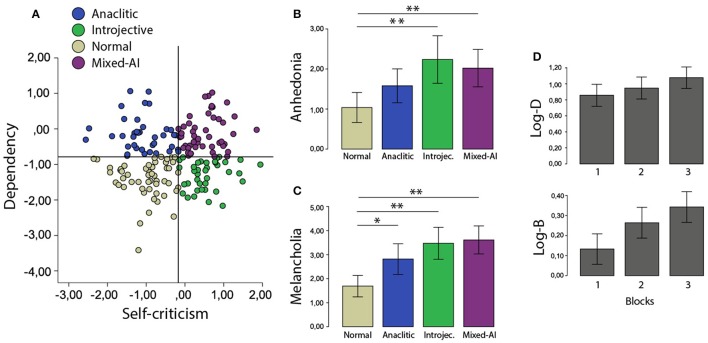
(A) Scatterplot to represent the cutoff points in the interaction between Dependency and Self-Criticism scores. Each point illustrates one participant and each color one category. (B) Melancholia and (C) Anhedonia for each POE group. (D) Discriminability and response bias along 3 Blocks. *P < 0.05 and **P < 0.01.

