
FIGURE 1.
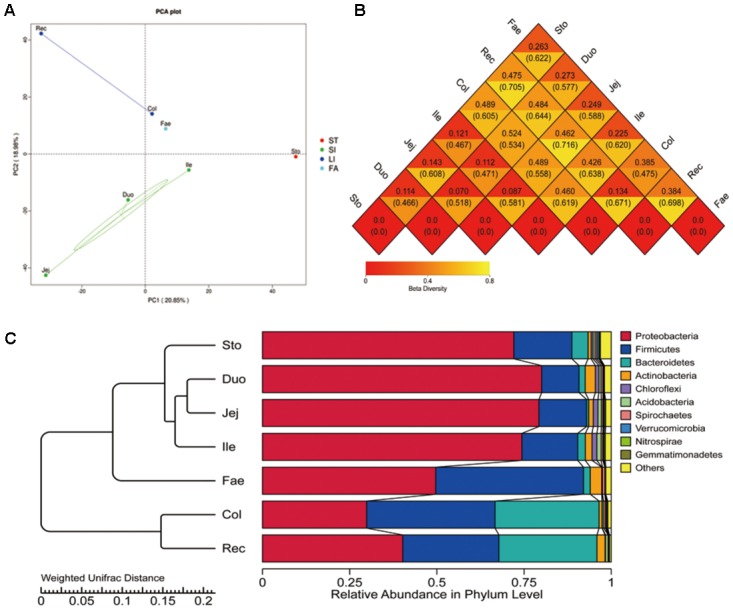
Beta diversity of microbiota in red panda GIT. (A) Principal component analysis (PCA) with unweighted uniFrac of bacterial community in GIT samples. (B) Heatmap of the distance matrix, number above and under the central line in each rhombus is calculated using the weighted uniFrac and unweighted uniFrac methods, with higher values showing significant differences. (C) Clustering of the microbiota at the phylum level. Sto, Duo, Jej, Ile, Col, Rec, and Fae represent samples from the stomach, duodenum, jejunum, ileum, colon, rectum, and faecal, respectively.