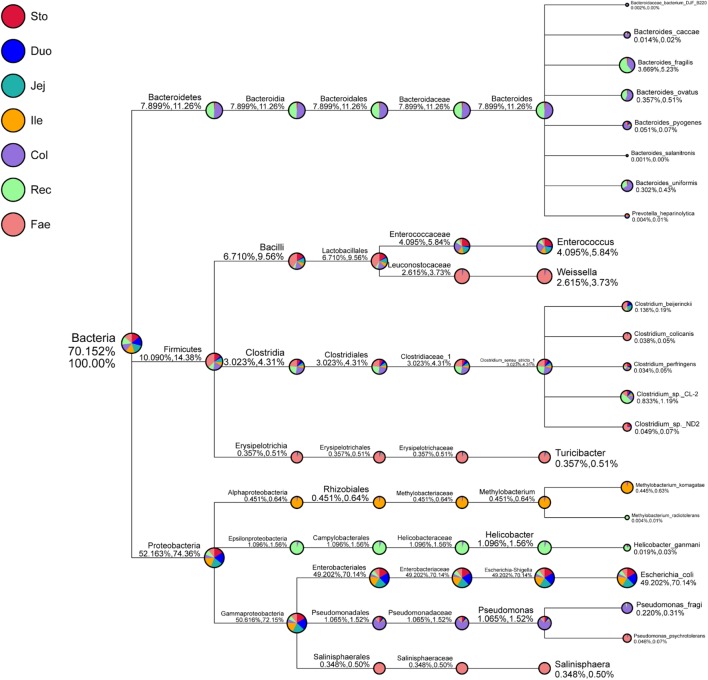
FIGURE 2.
Specific species taxonomy tree analysis of microbiota in red panda GIT. Classification levels include the kingdom, phylum, class, order, family, genus, and species. The first percentile in parentheses shows the percentage of microflora in all the detected bacteria. The second percentile in parentheses shows the percentage of microflora in all the selected bacteria. Sto, Duo, Jej, Ile, Col, Rec, and Fae represent samples from the stomach, duodenum, jejunum, ileum, colon, rectum, and faecal, respectively.

