Fig. 2.
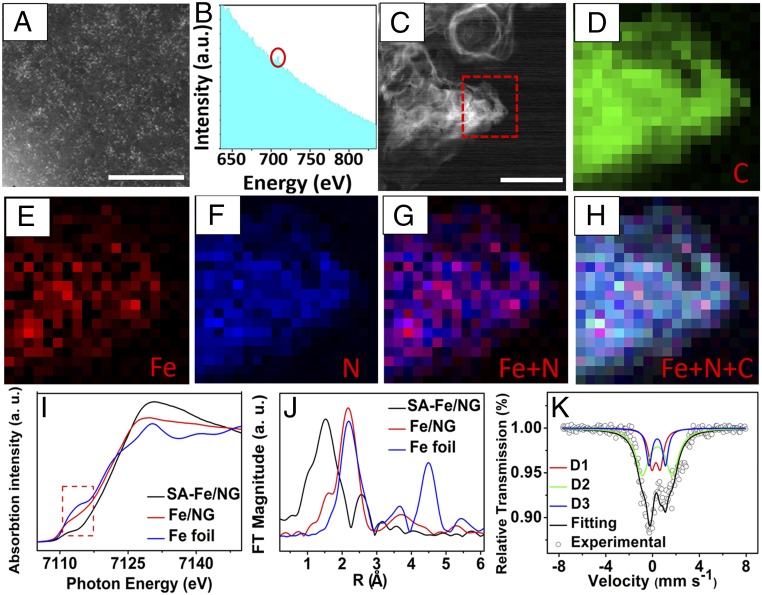
The structure characterizations of SA-Fe/NG at atomic scales. (A) HAADF STEM image of the SA-Fe/NG with iron atom bright points. (Scale bar, 5 nm.) (B) EELS atomic spectra of Fe element from the bright points, where the Fe was designated by red circle. (C) TEM image of SA-Fe/NG; the red box area in C was further analyzed by EELS mapping with 4× magnification in D–H. (Scale bar, 200 nm.) (D–H) EELS mapping of carbon, iron, nitrogen, and superimposed iron and nitrogen and superimposed iron, nitrogen, and carbon for SA-Fe/NG sample. (I) XANES spectra and (J) Fourier transforms of Fe K-edge spectra of SA-Fe/NG, Fe/NG, and Fe foil. (K) 57Fe Mössbauer spectroscopy of SA-Fe/NG.

