Fig. 2.
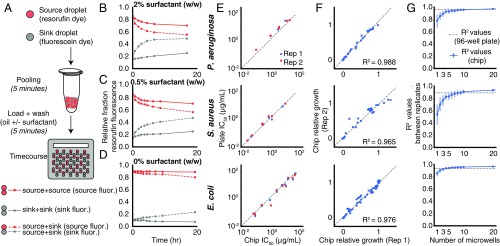
Characterization of droplet platform performance. (A) To model cross-contamination, we tracked the exchange of the fluorescent dye resorufin (carried by source droplets) to empty droplets (sink droplets, encoded by fluorescein). (B–D) Exchange is measured over time by the fraction of fluorescence measured in source droplets (red lines) and sink droplets (gray lines) as a function of surfactant wash concentration (0%, 0.5%, and 2% wt/wt). The effect of compartmentalization is measured by comparing the rates of dye accumulation in sink droplets when cocompartmentalized in microwells with source droplets (dotted lines) or other sink droplets (solid lines). Exchange that occurred before loading was measured by the fraction of fluorescence in sink droplets at the first time point (SI Appendix, Supplementary Text and Fig. S4F). (E) Estimated IC50 for each antibiotic compared between 96-well plate and droplet platform formats (SI Appendix, Figs. S8–S10). Dotted lines show the diagonal. (F) Comparison of two technical replicates on the droplet platform of growth values at particular antibiotic dosages normalized to a media-only control (SI Appendix, Figs. S8–S10). Dotted lines show line of best fit. (G) Relationship between microwell-level replication and technical noise, estimated by bootstrap resampling of the data in F. Error bars represent 10th- to 90th-percentile bootstrapped R2 values. Dotted lines represent R2 values between technical replicates in 96-well plates (SI Appendix, Fig. S11).

