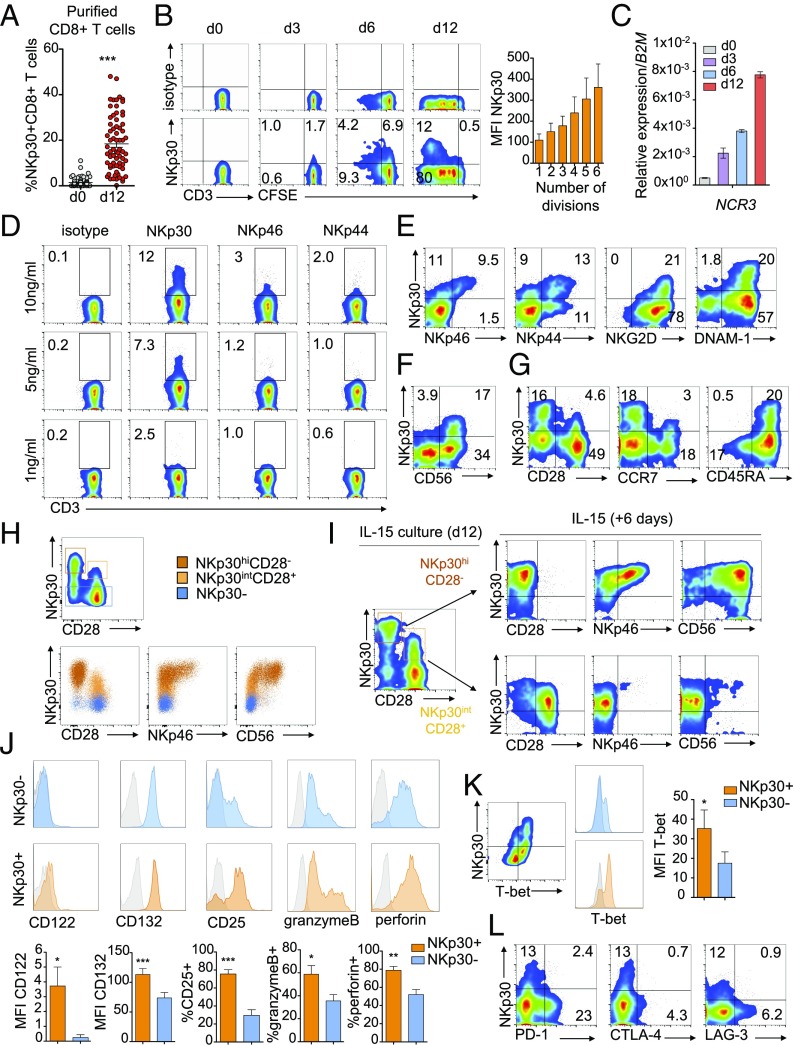
Fig. 2.
IL-15 can induce the generation of a NKp30+CD8+ T cell population coexpressing other NCRs and low levels of exhaustion markers. Highly purified human peripheral blood CD8+ T cells were cultured for 12 d with IL-15. (A) Percentage of NKp30 receptor-expressing CD8+ T cells after isolation (day 0) and on day 12, analyzed by flow cytometry. n = 64–67; data are shown as mean ± SEM; ***P ≤ 0.001; paired Student’s t test. (B, Left) Representative plots showing NKp30 receptor expression on day 0 and kinetics with carboxyfluorescein succinimidyl ester (CFSE) dilution on days 3, 6, and 12. (Right) Graph showing the increase in NKp30 MFI expression with the division number (according with CFSE dilution) on gated NKp30+CD8+ T cells. n = 3; data are shown as mean ± SEM. (C) Representative qPCR analysis of NCR3 expression (relative to B2M) on days 0, 3, 6, and 12. Data are shown as mean ± SEM. (D) FACS plots showing NKp30, NKp46, and NKp44 expression after culture with the indicated amounts of IL-15. (E and F) Flow cytometry plots showing the coexpression of other NK receptors with NKp30 on day 12. (G) Plots showing NKp30, CD28, CCR7, and CD45RA expression on day 12. (H) FACS plots showing NKp30, CD28, NKp46, and CD56 expression on day 12 FACS-sorted NKp30−, NKp30intCD28+, or NKp30hiCD28− CD8+ T cell populations. (I) Day 12 FACS-sorted NKp30hiCD28− or NKp30intCD28+ CD8+ T cell populations were cultured with IL-15 for six additional days, and NKp30, CD28, NKp46, and CD56 expression was analyzed by FACS. (J, Upper) Representative histograms showing expression of IL-2/15 receptor molecules, granzyme B, and perforin on day 12, gated on NKp30+ or NKp30− CD8+ T cells. (Lower) Graphs show mean ± SEM of n = 3–7 independent donors. (K) Representative FACS plot (Left) and corresponding histograms (Center) gated on NKp30+ or NKp30− CD8+ T cells, showing T-bet and NKp30 expression on day 12. (Right) Graph showing mean ± SEM; n = 3 independent donors. (J and K) ***P ≤ 0.001, **P ≤ 0.01, *P ≤ 0.05; paired Student’s t test. (L) Expression of NKp30 and PD-1, CTLA-4, and LAG-3 on day 12. Data representative of three or more independent experiments from different donors are shown.

