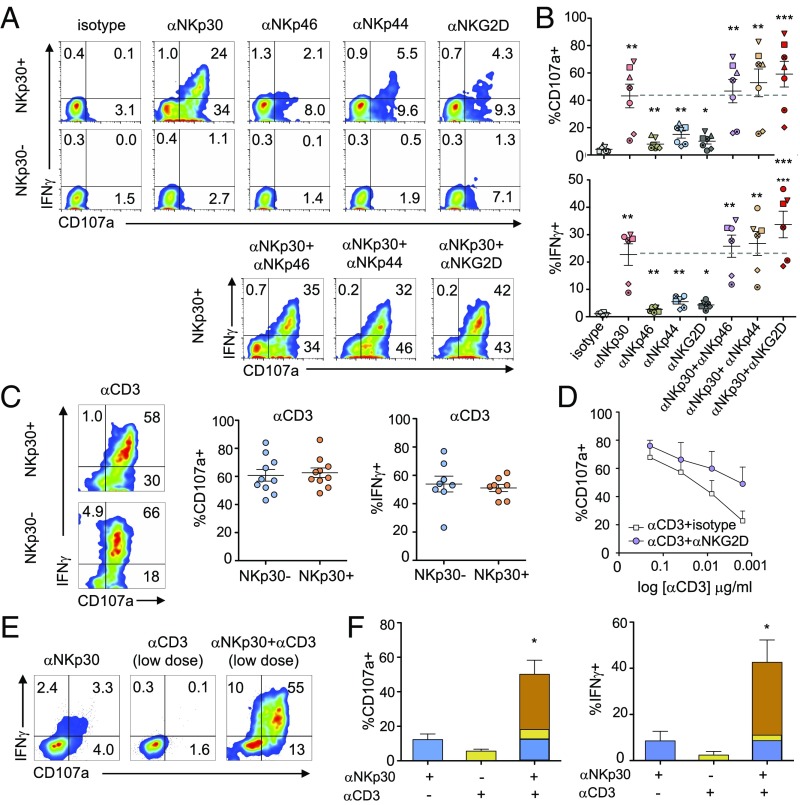
Fig. 3.
IL-15–induced NKp30+CD8+ T cells express functional NCRs that can synergize with TCR activation in degranulation and IFNγ production. Purified CD8+ T cells were cultured with IL-15 and were FACS-sorted on day 12 into NKp30+ and NKp30− CD8+ T cells. Sorted cells were then stimulated with the indicated plate-bound mAbs for 4 h. (A) Representative flow cytometry plots showing degranulation (CD107a) and intracellular IFNγ expression by sorted NKp30+ or NKp30− CD8+ T cells after triggering with plate-bound mAb (5 μg/mL). (B) Graphs showing the percentage of CD107a+ (Upper) and IFNγ+ (Lower) cells from six or seven independent donors. Data are shown as mean ± SEM; ***P ≤ 0.001, **P ≤ 0.01, *P ≤ 0.05; paired Student’s t test. Each independent donor is represented by a different symbol. (C, Left) FACS plots representing CD107a and intracellular IFNγ expression by sorted populations after anti-CD3 (0.4 μg/mL) plate-bound stimulation. (Center and Right) Corresponding graphs showing the percentage of CD107a+ and IFNγ+ cells from 9 or 10 independent donors. Data are shown as mean ± SEM. (D) Graph showing the percentage of CD107a+ cells after triggering of sorted NKp30+CD8+ T cells with sequential dilutions of plate-bound anti-CD3 mAb (starting with 2 μg/mL) alone or with anti-NKG2D mAb (5 μg/mL). Data are shown as the mean ± SEM for six independent donors. (E) FACS plots showing sorted NKp30+CD8+ T cell responses (percent CD107a+ and percent IFNγ+) to triggering with low dose of anti-CD3 mAb (0.016 μg/mL) alone or with anti-NKp30 mAb (5 μg/mL). (F) Corresponding graphs showing the percentages of CD107a+ (Left) and IFNγ+ (Right) cells from three independent donors. Data are shown as the mean ± SEM; *P ≤ 0.05; paired Student’s t test.

