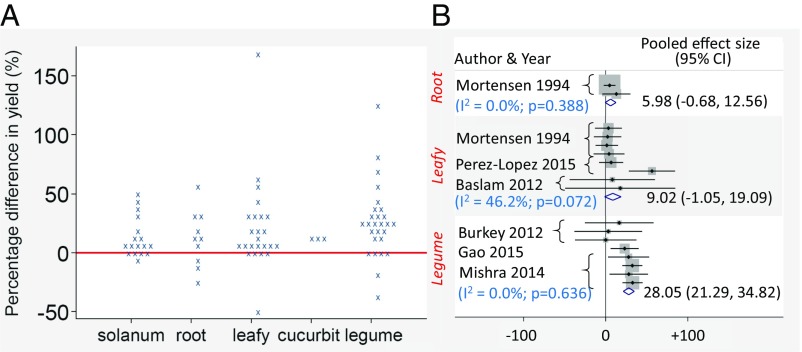
Fig. 3.
Dot plot (A) and forest plot (B) showing the available experimental evidence of yield changes in vegetables and legumes resulting from a standardized increase of 250 ppm CO2 concentration. More details of the forest plot are provided in SI Appendix.

