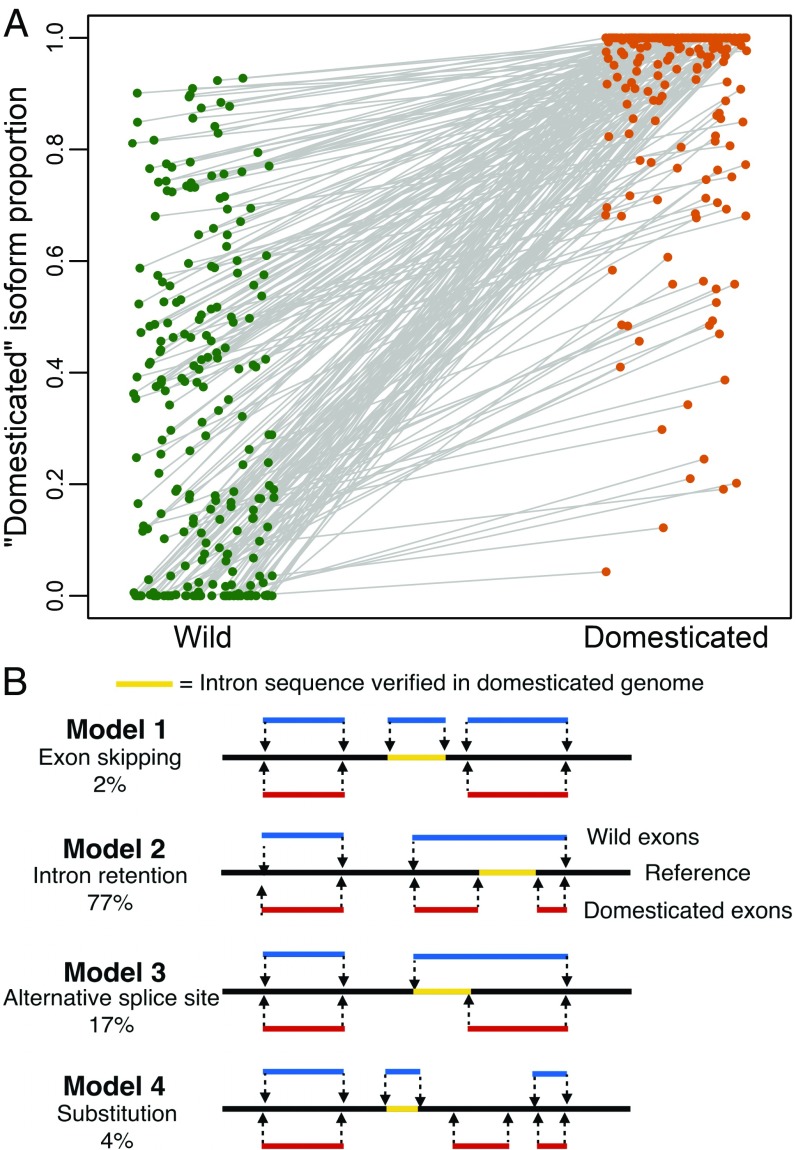
Fig. 1.
(A) Parental types have differentiated isoform composition for 226 transcripts. Points show the mean proportion of the domesticated isoform in each parental type, where the domesticated isoform is the primary isoform of HA 89. Gray lines connect each isoform between the samples, with the slope representing the magnitude of differentiation. (B) Basic alignment configurations for validating alternative splicing.

