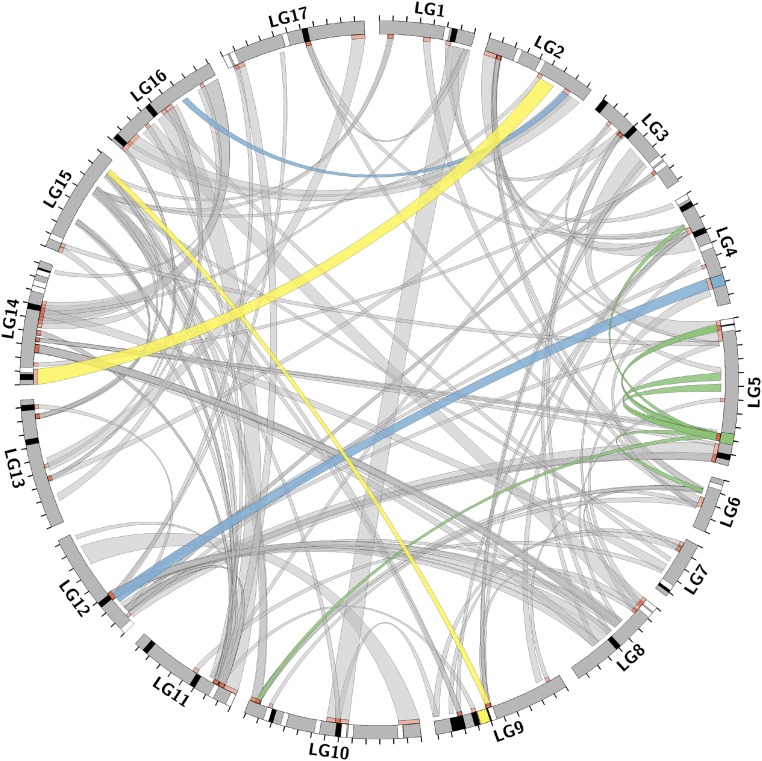
Fig. 2.
Differential splicing regulation diagram. The 17 linkage groups are depicted circularly, with clockwise megabase-pair tick marks. Links connect QTLs (orange-red) to genes with differential splicing with which they are associated. Link width corresponds to percentage variance explained. White bands are genes with splicing that is entirely cis-regulated. Black bands are QTLs that regulate splicing on the same chromosome but >1 cM away. Band widths do not represent QTL widths. Colored bands and links are referenced in the text. Figure made with Circos (29).

