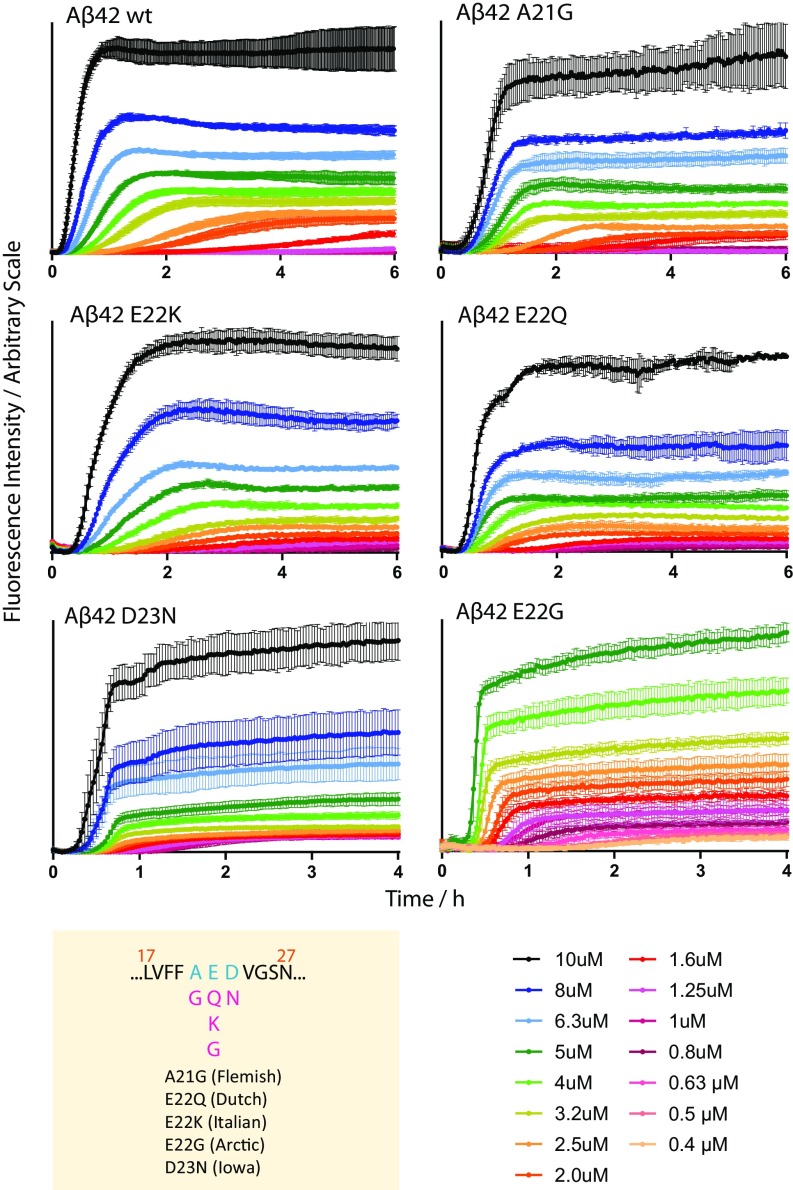
Fig. 3.
Concentration-dependent aggregation kinetics data of A42 WT and five familial mutants—A21G, E22K, E22Q, E22G, and D23N—at 37 °C. ThT fluorescence was monitored as a function of time for initially monomeric samples with peptide concentrations in the range of 0.4 to 10 M. Each color represents the average fluorescence signal intensity of four replicates at the same peptide concentration. All samples contain 6 M ThT, 20 mM sodium phosphate, 200 M EDTA, and 0.02% NaN3, at pH 8.0. The mutation sites of the five familial mutants are shown below the WT sequence (residues 17 to 27) in the yellow panel. Fits of these data are shown in Fig. 5, their half times are shown in SI Appendix, Fig. S4.

