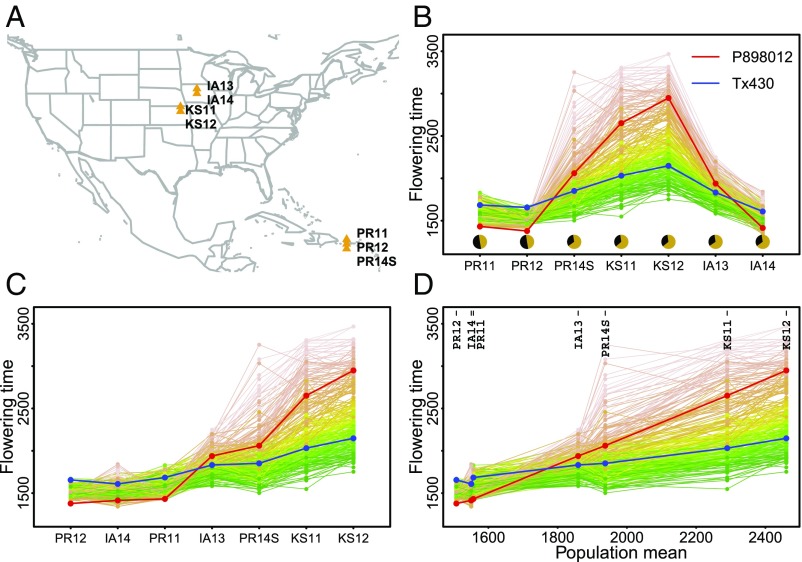
Fig. 1.
Pattern finding in flowering time G × E of a genetic mapping population. Progression from data visualization of apparently complex G × E to pattern discovery: (A) Seven natural field environments. (B) Reaction norm based on a categorical order of photoperiod of seven environments. (C) Reaction norm based on a categorical order of population means for individual environments. (D) Reaction norm based on a numerical order of population means for individual environments. Flowering time expressed as GDD was analyzed. Each line connects the flowering time values of individual RIL across environments.

